Power BI – Visualisation – Org Chart
Spent some time experimenting with the excellent “Synoptic Panel by OKViz” custom visualisation and came up with the idea of finding a different way to visualise the costs associated with a companies organisation structure.
Organisation Chart & Associated Salaries and Costs Report

Image 1: Report showing Total Salaries and Costs for a fictitious organisation. The Organisation Chart diagram in the center is an SVG file that has been added to the report using the “Synoptic Panel by OKViz” custom visual.
Click HERE to open up the interactive reports in a new tab.
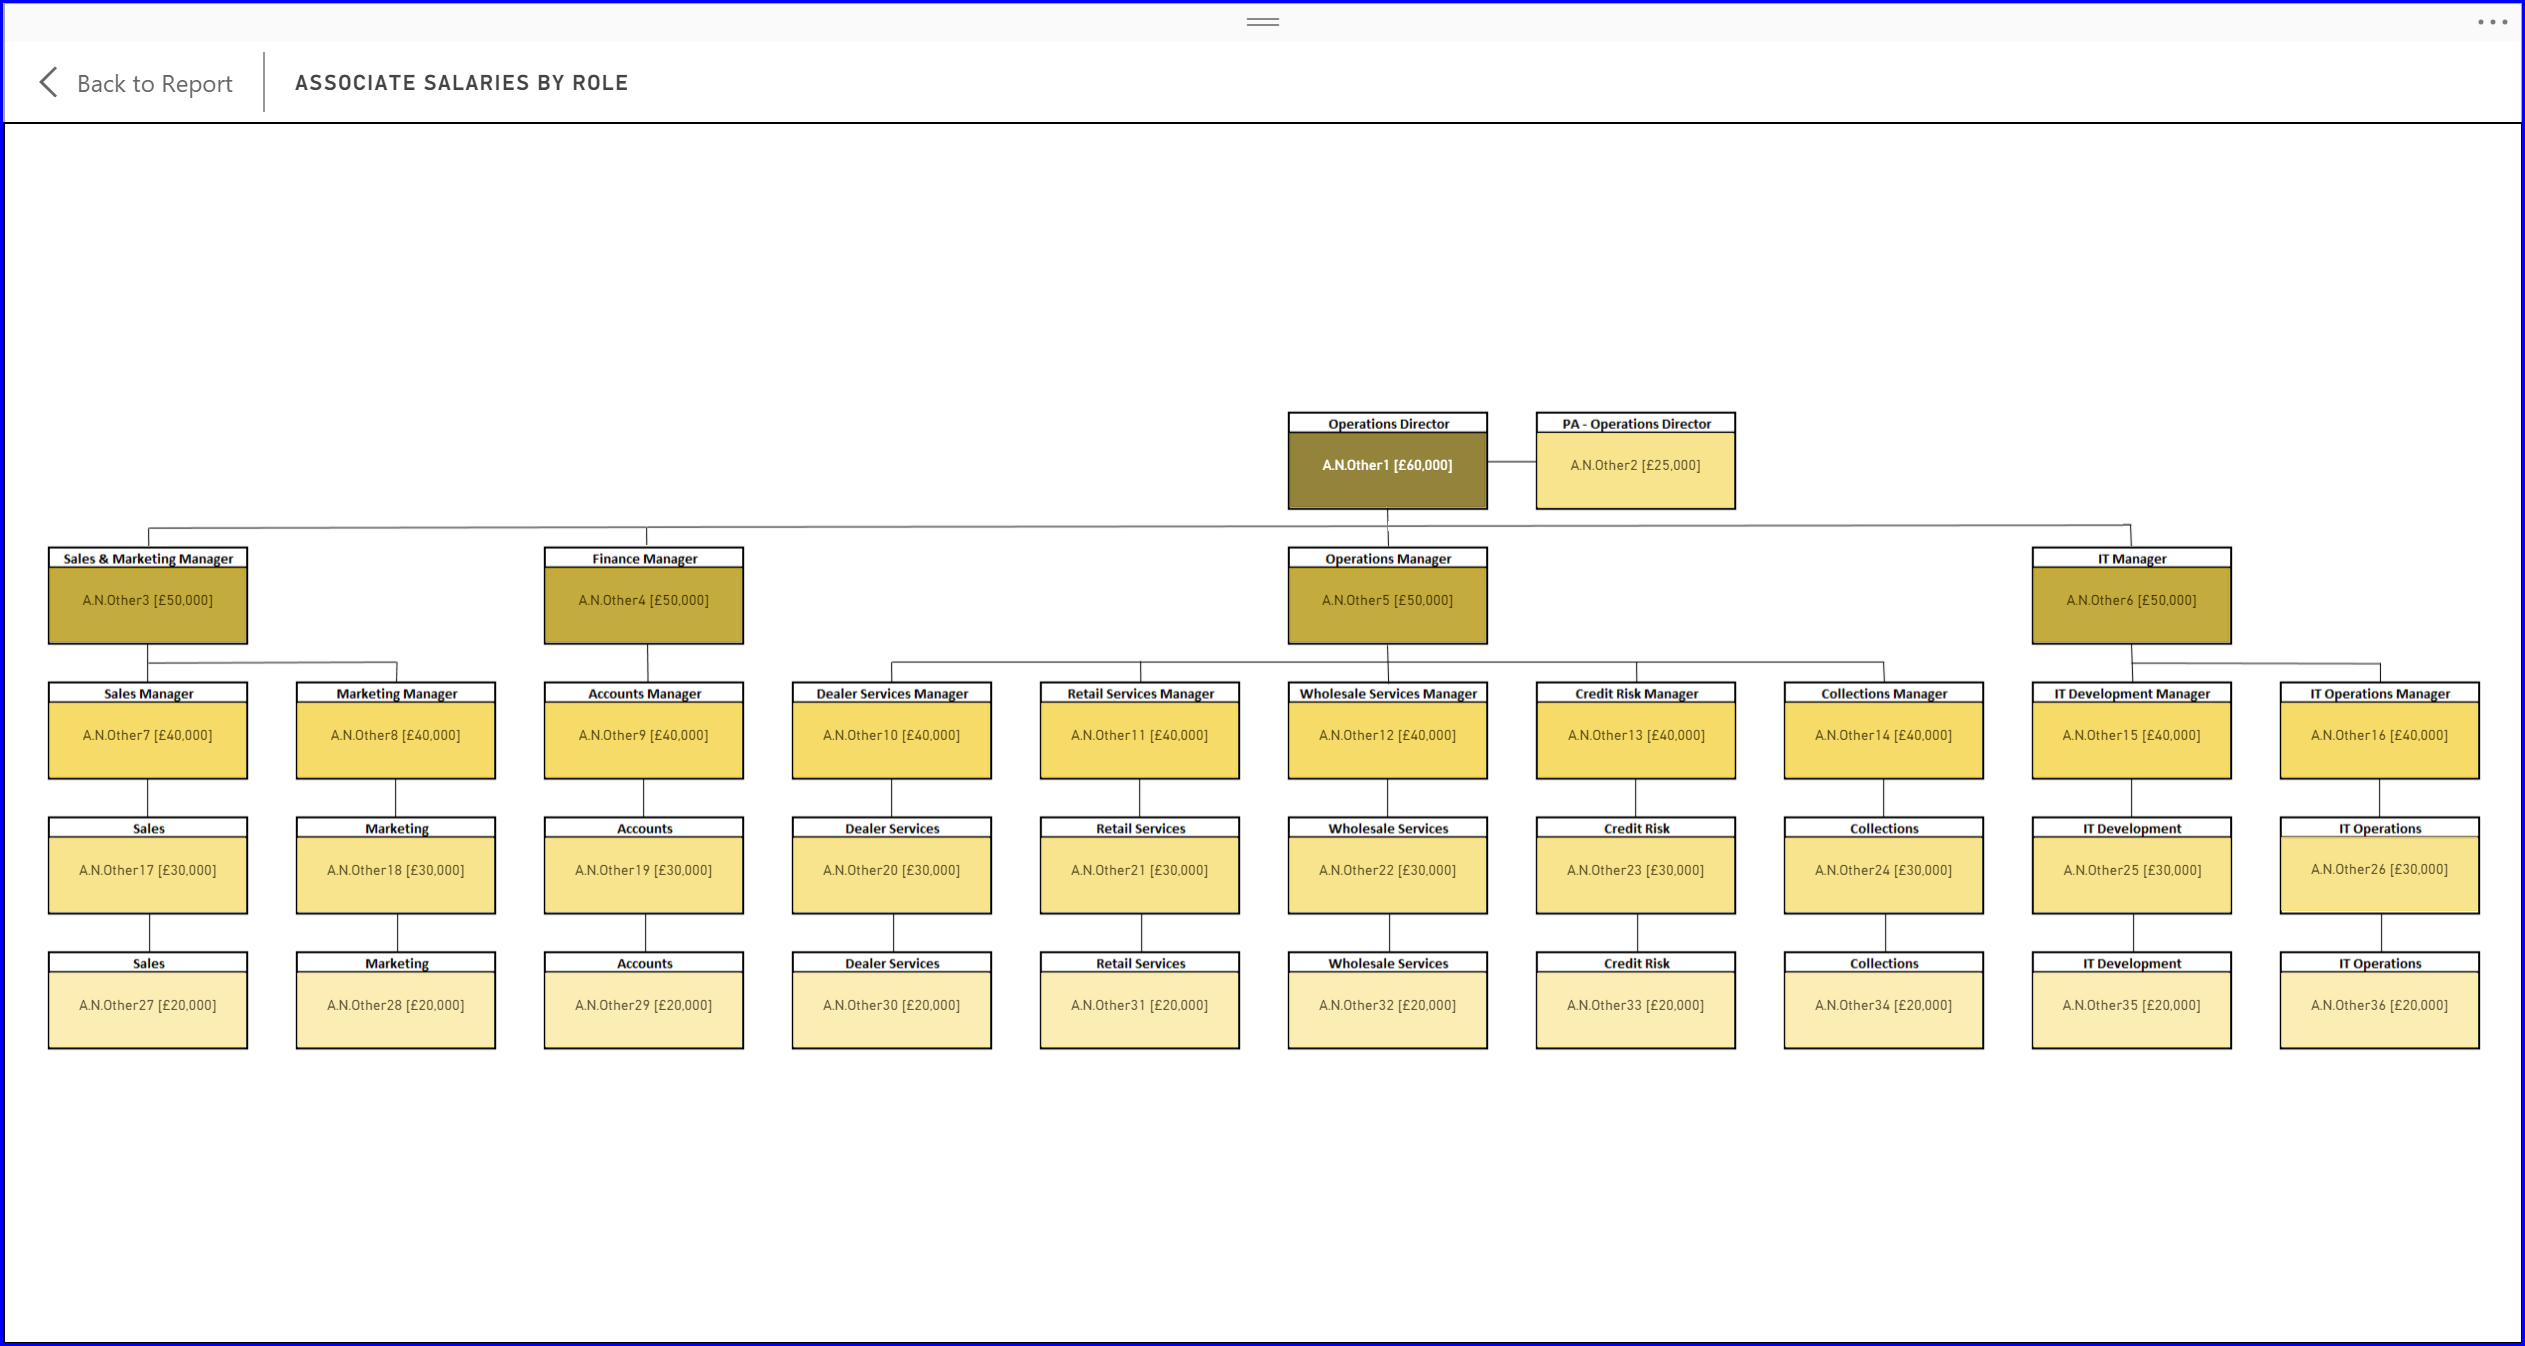
Image 2: The Organisation Chart that has been added to the report using the “Synoptic Panel by OKViz” custom visual. The chart is linked to a structured table that contains descriptions of the roles and the associated salary and costs. The colours indicate in which range/state the salary sits.
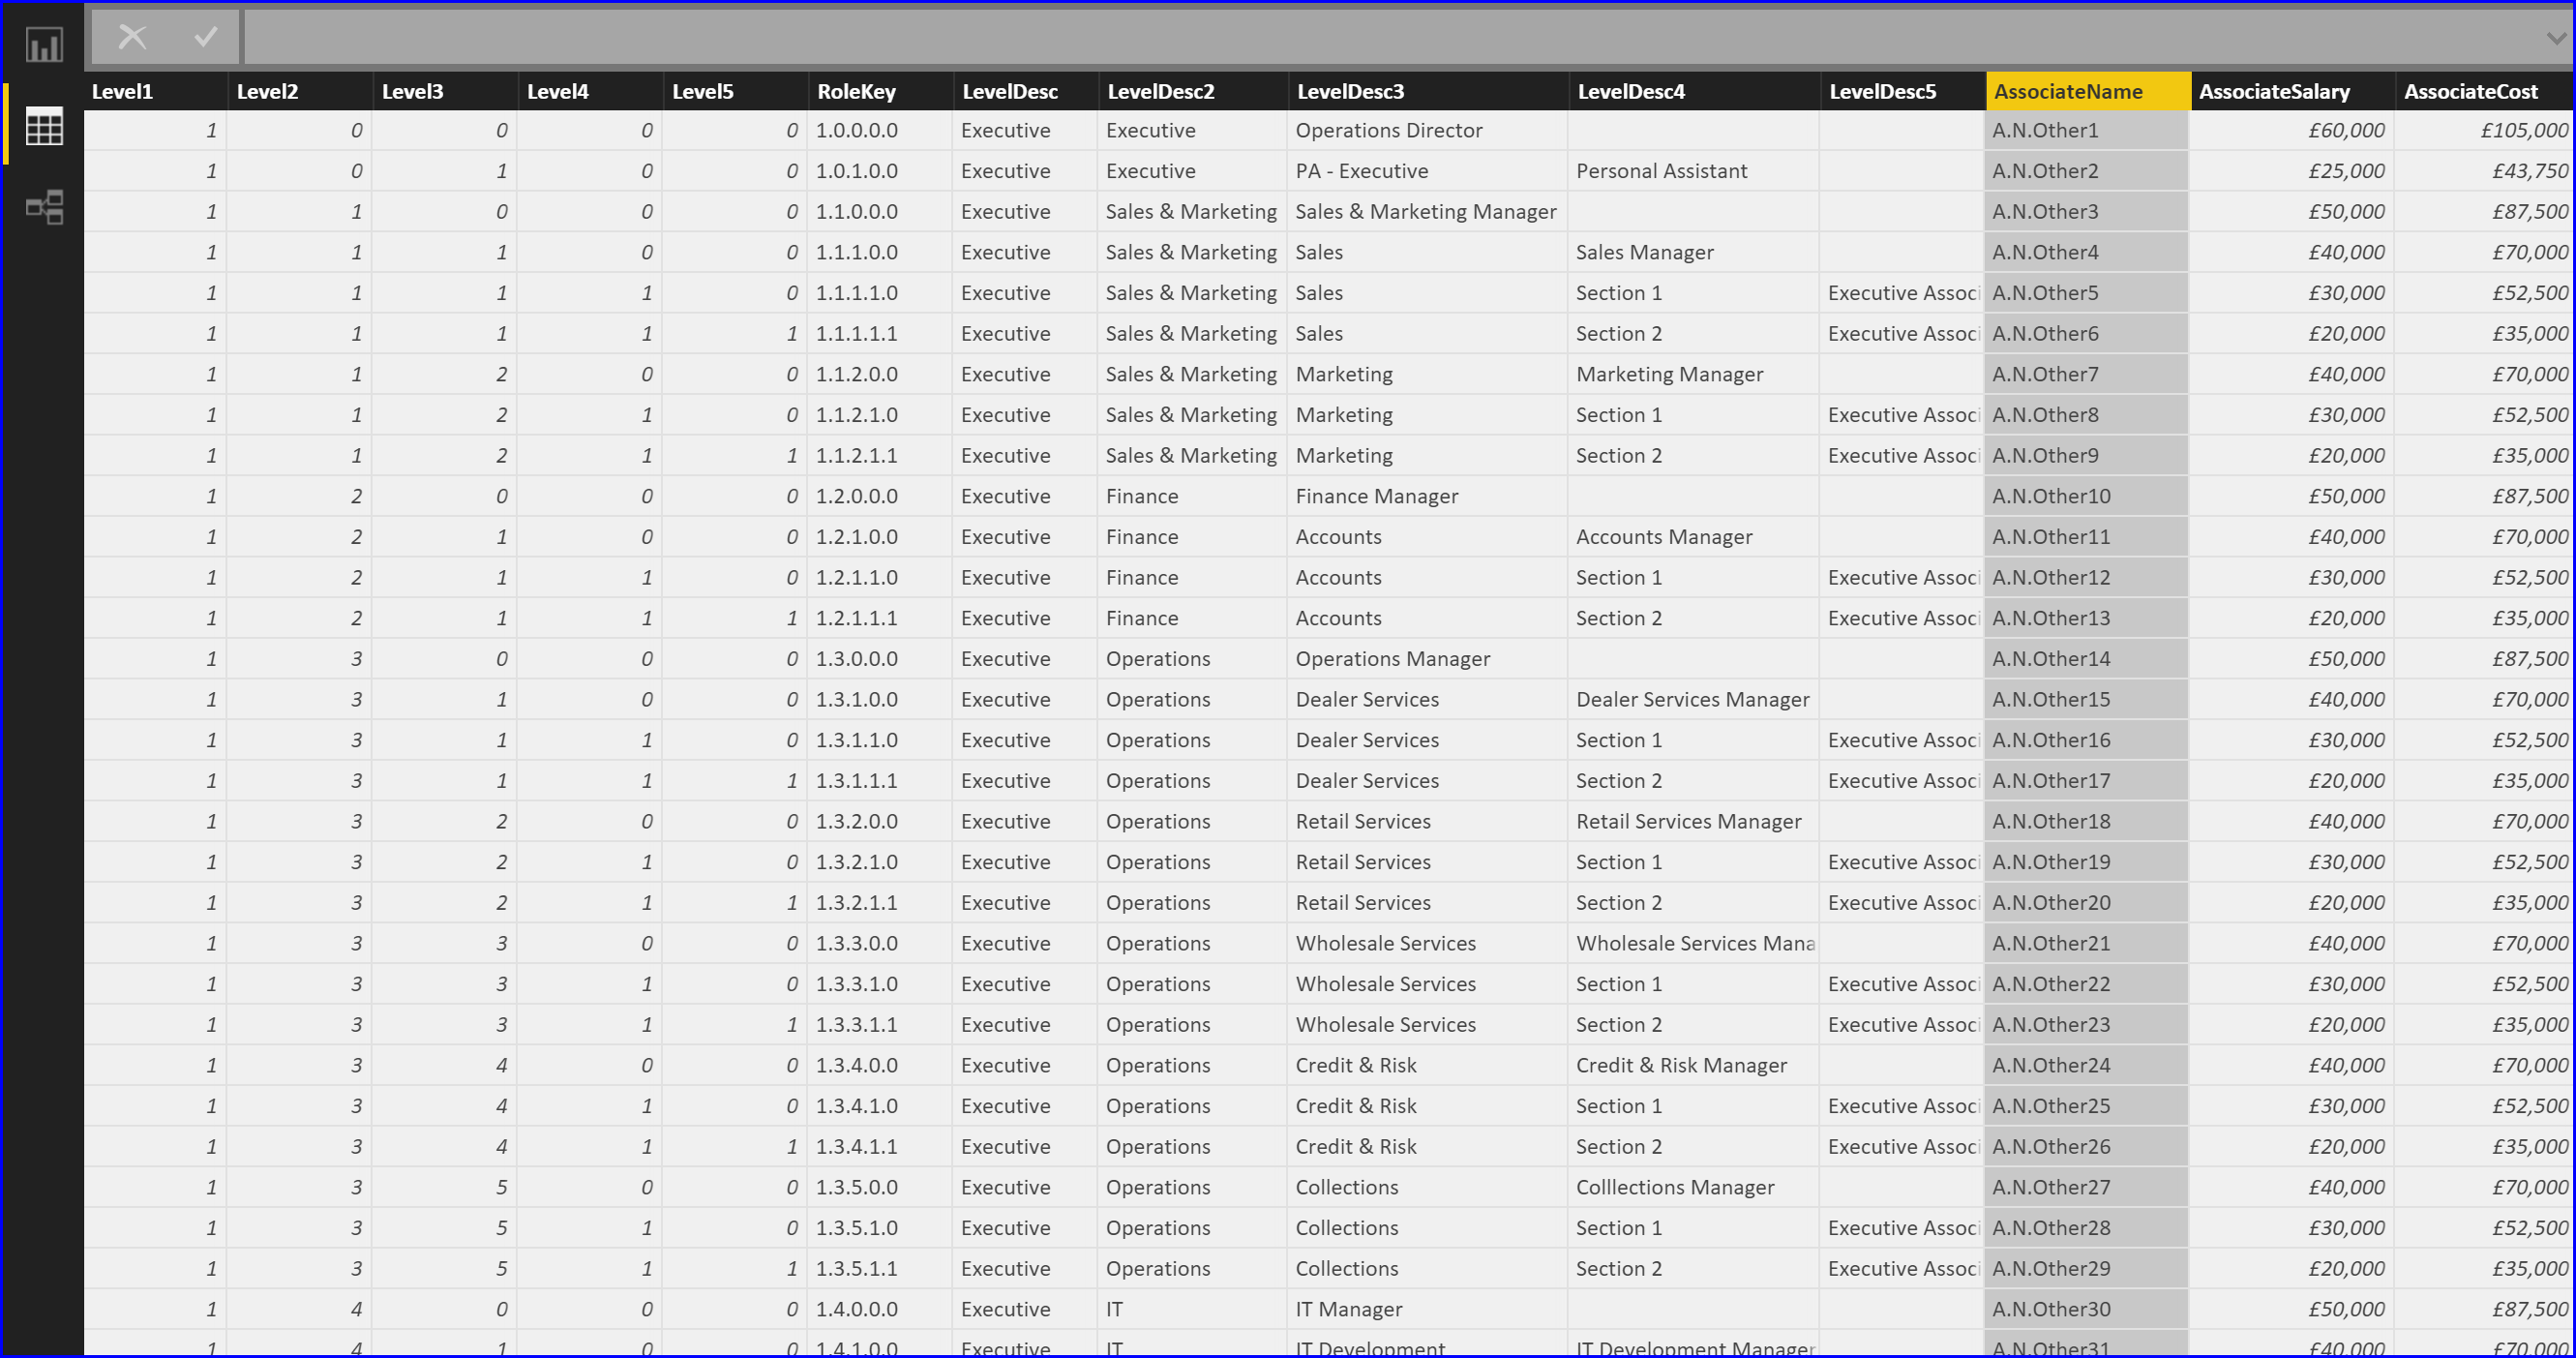
Image 3: The table that is linked to the various visualisations in the report.
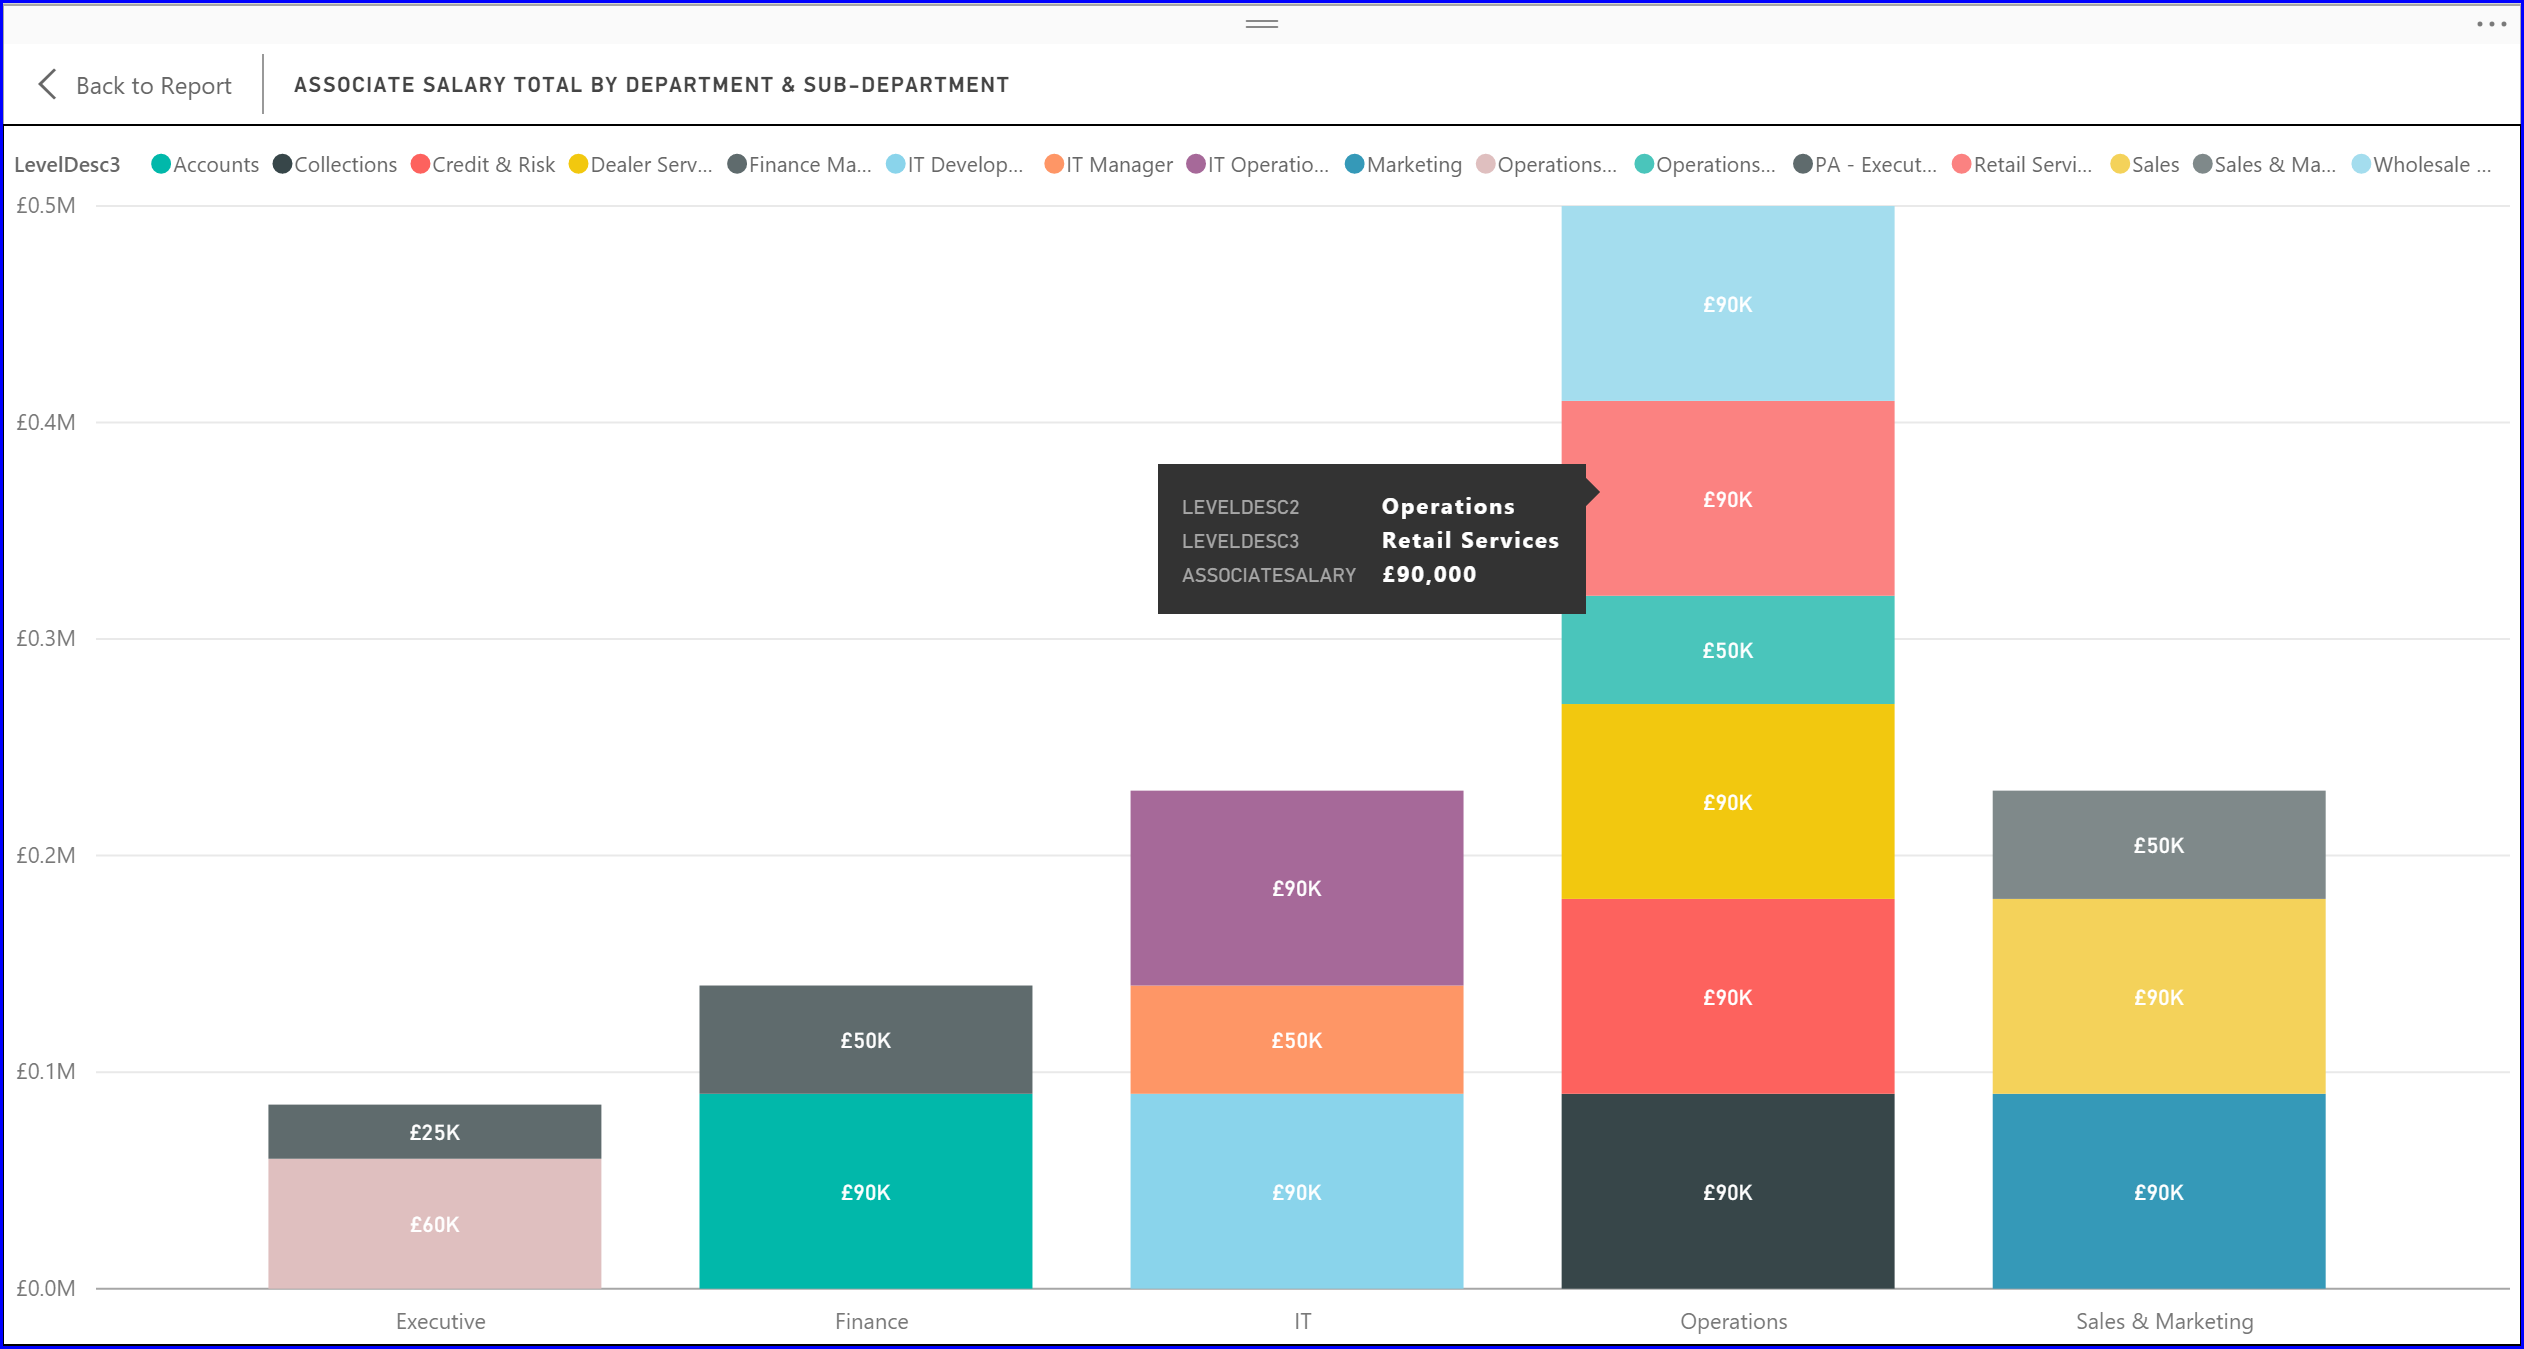
Image 4: A “Stacked Column Chart” showing the Associate Salary Total by Department and Sub-Departments.
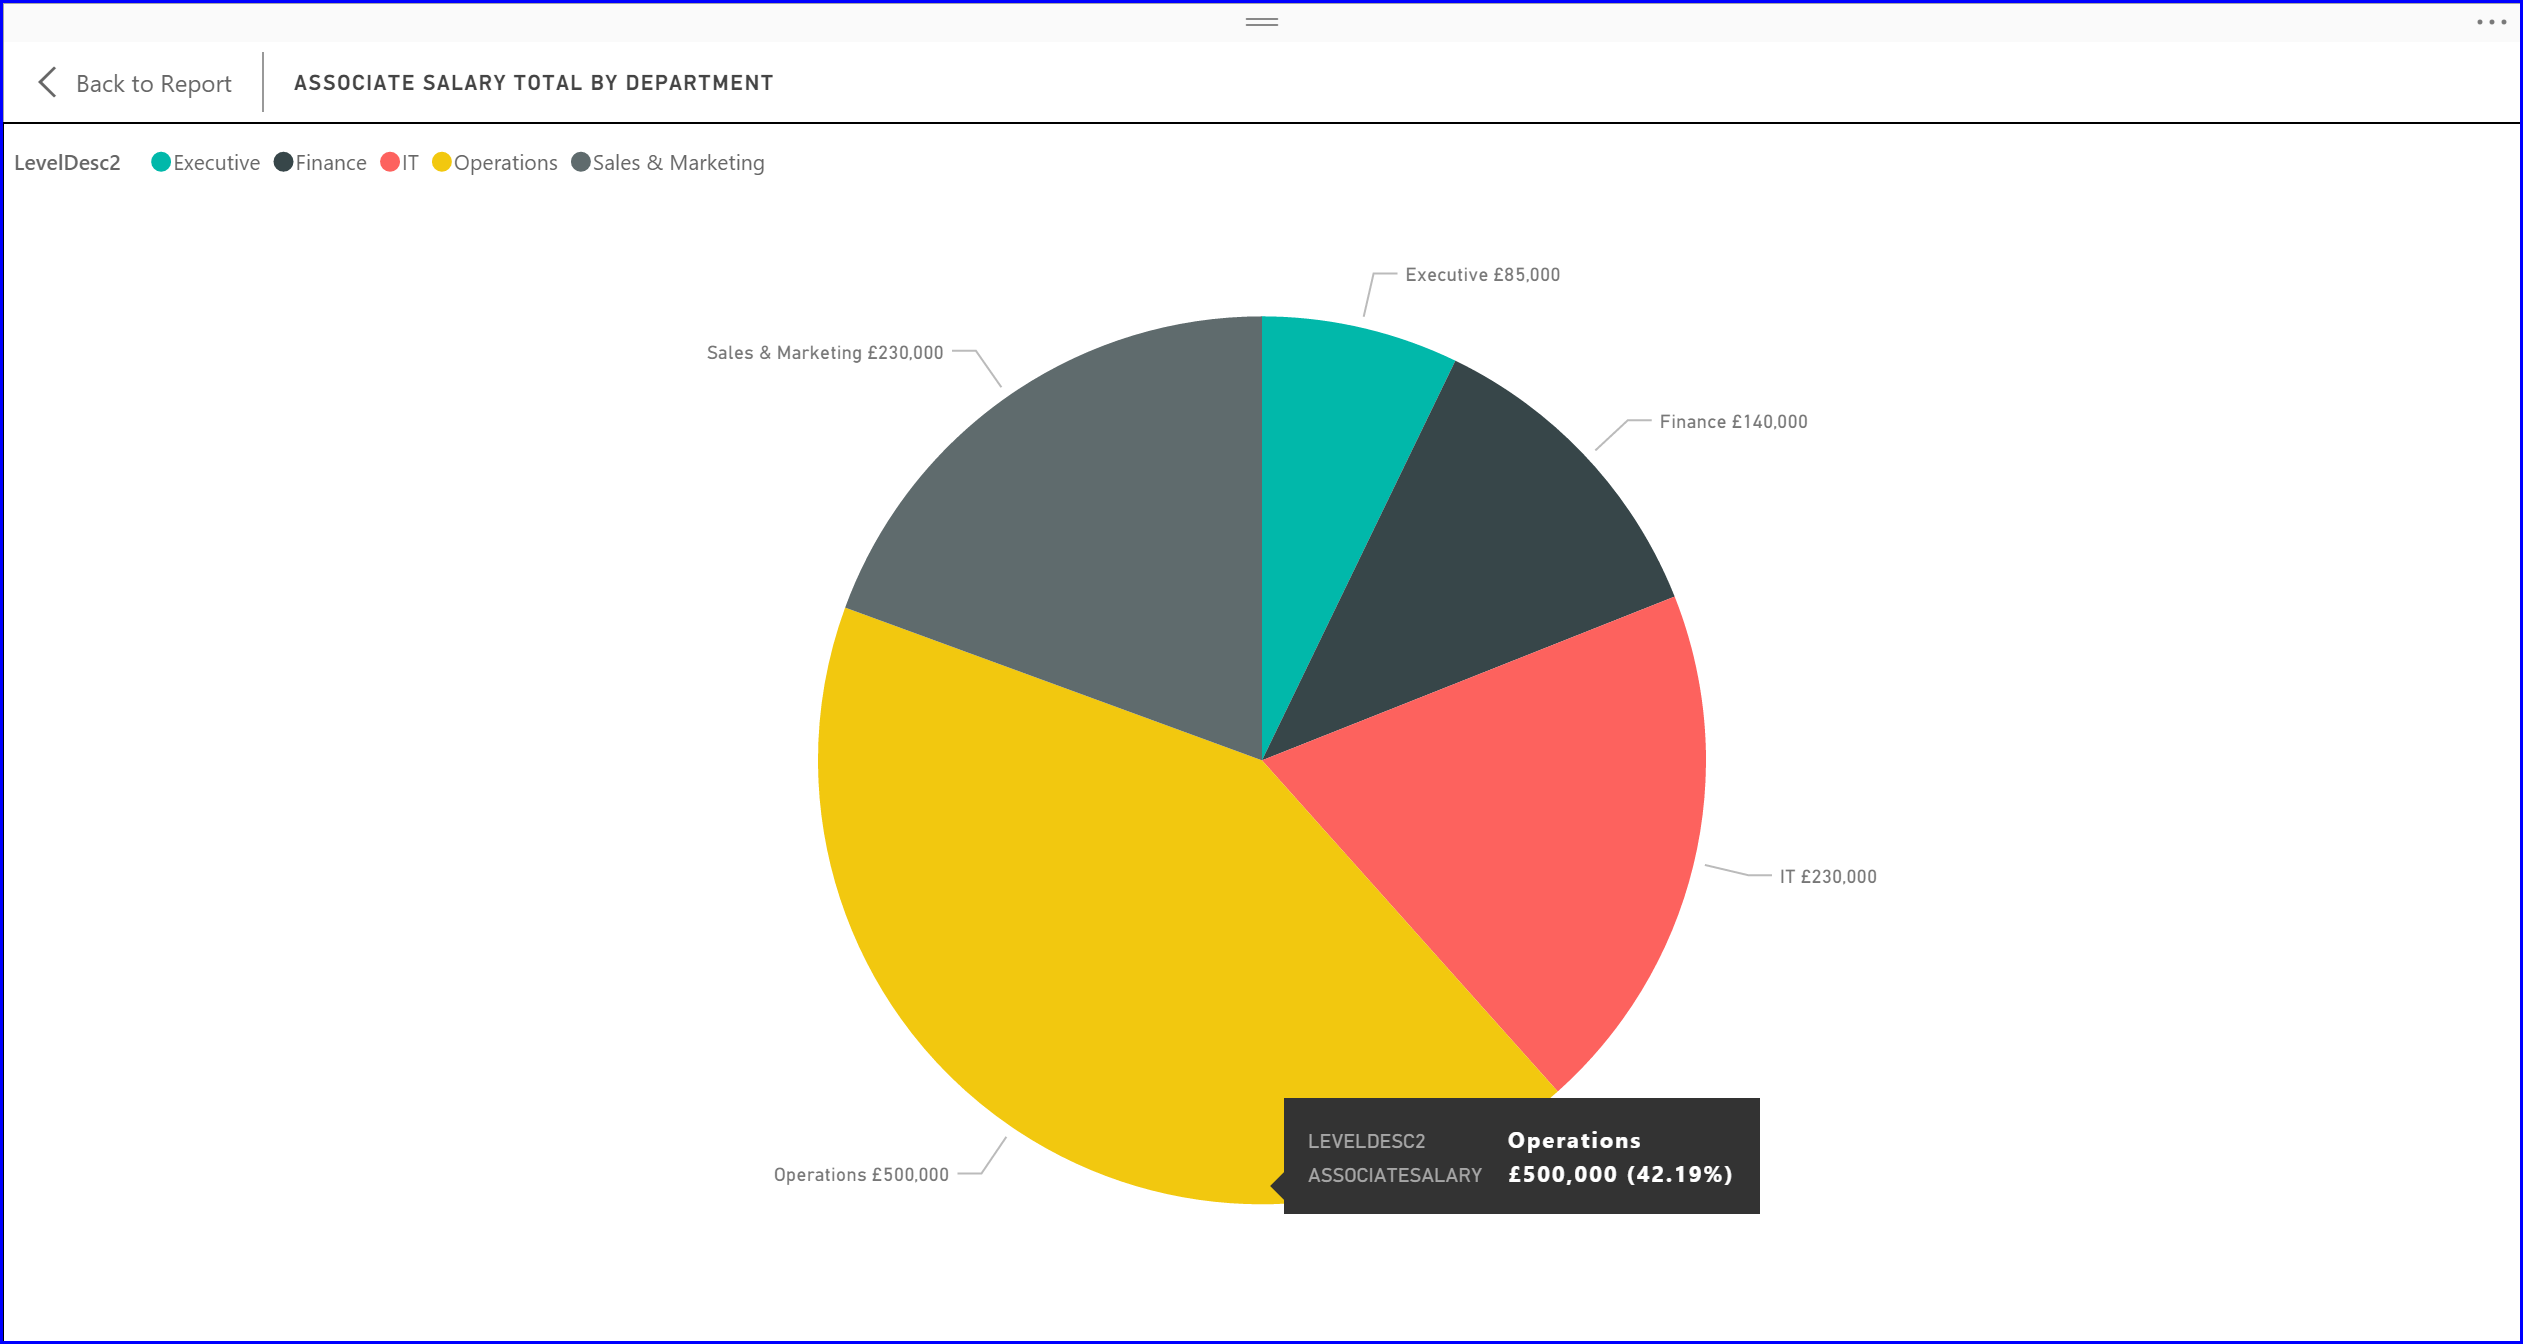
Image 5: A “Pie Chart” showing the Associate Salary Total by Department.
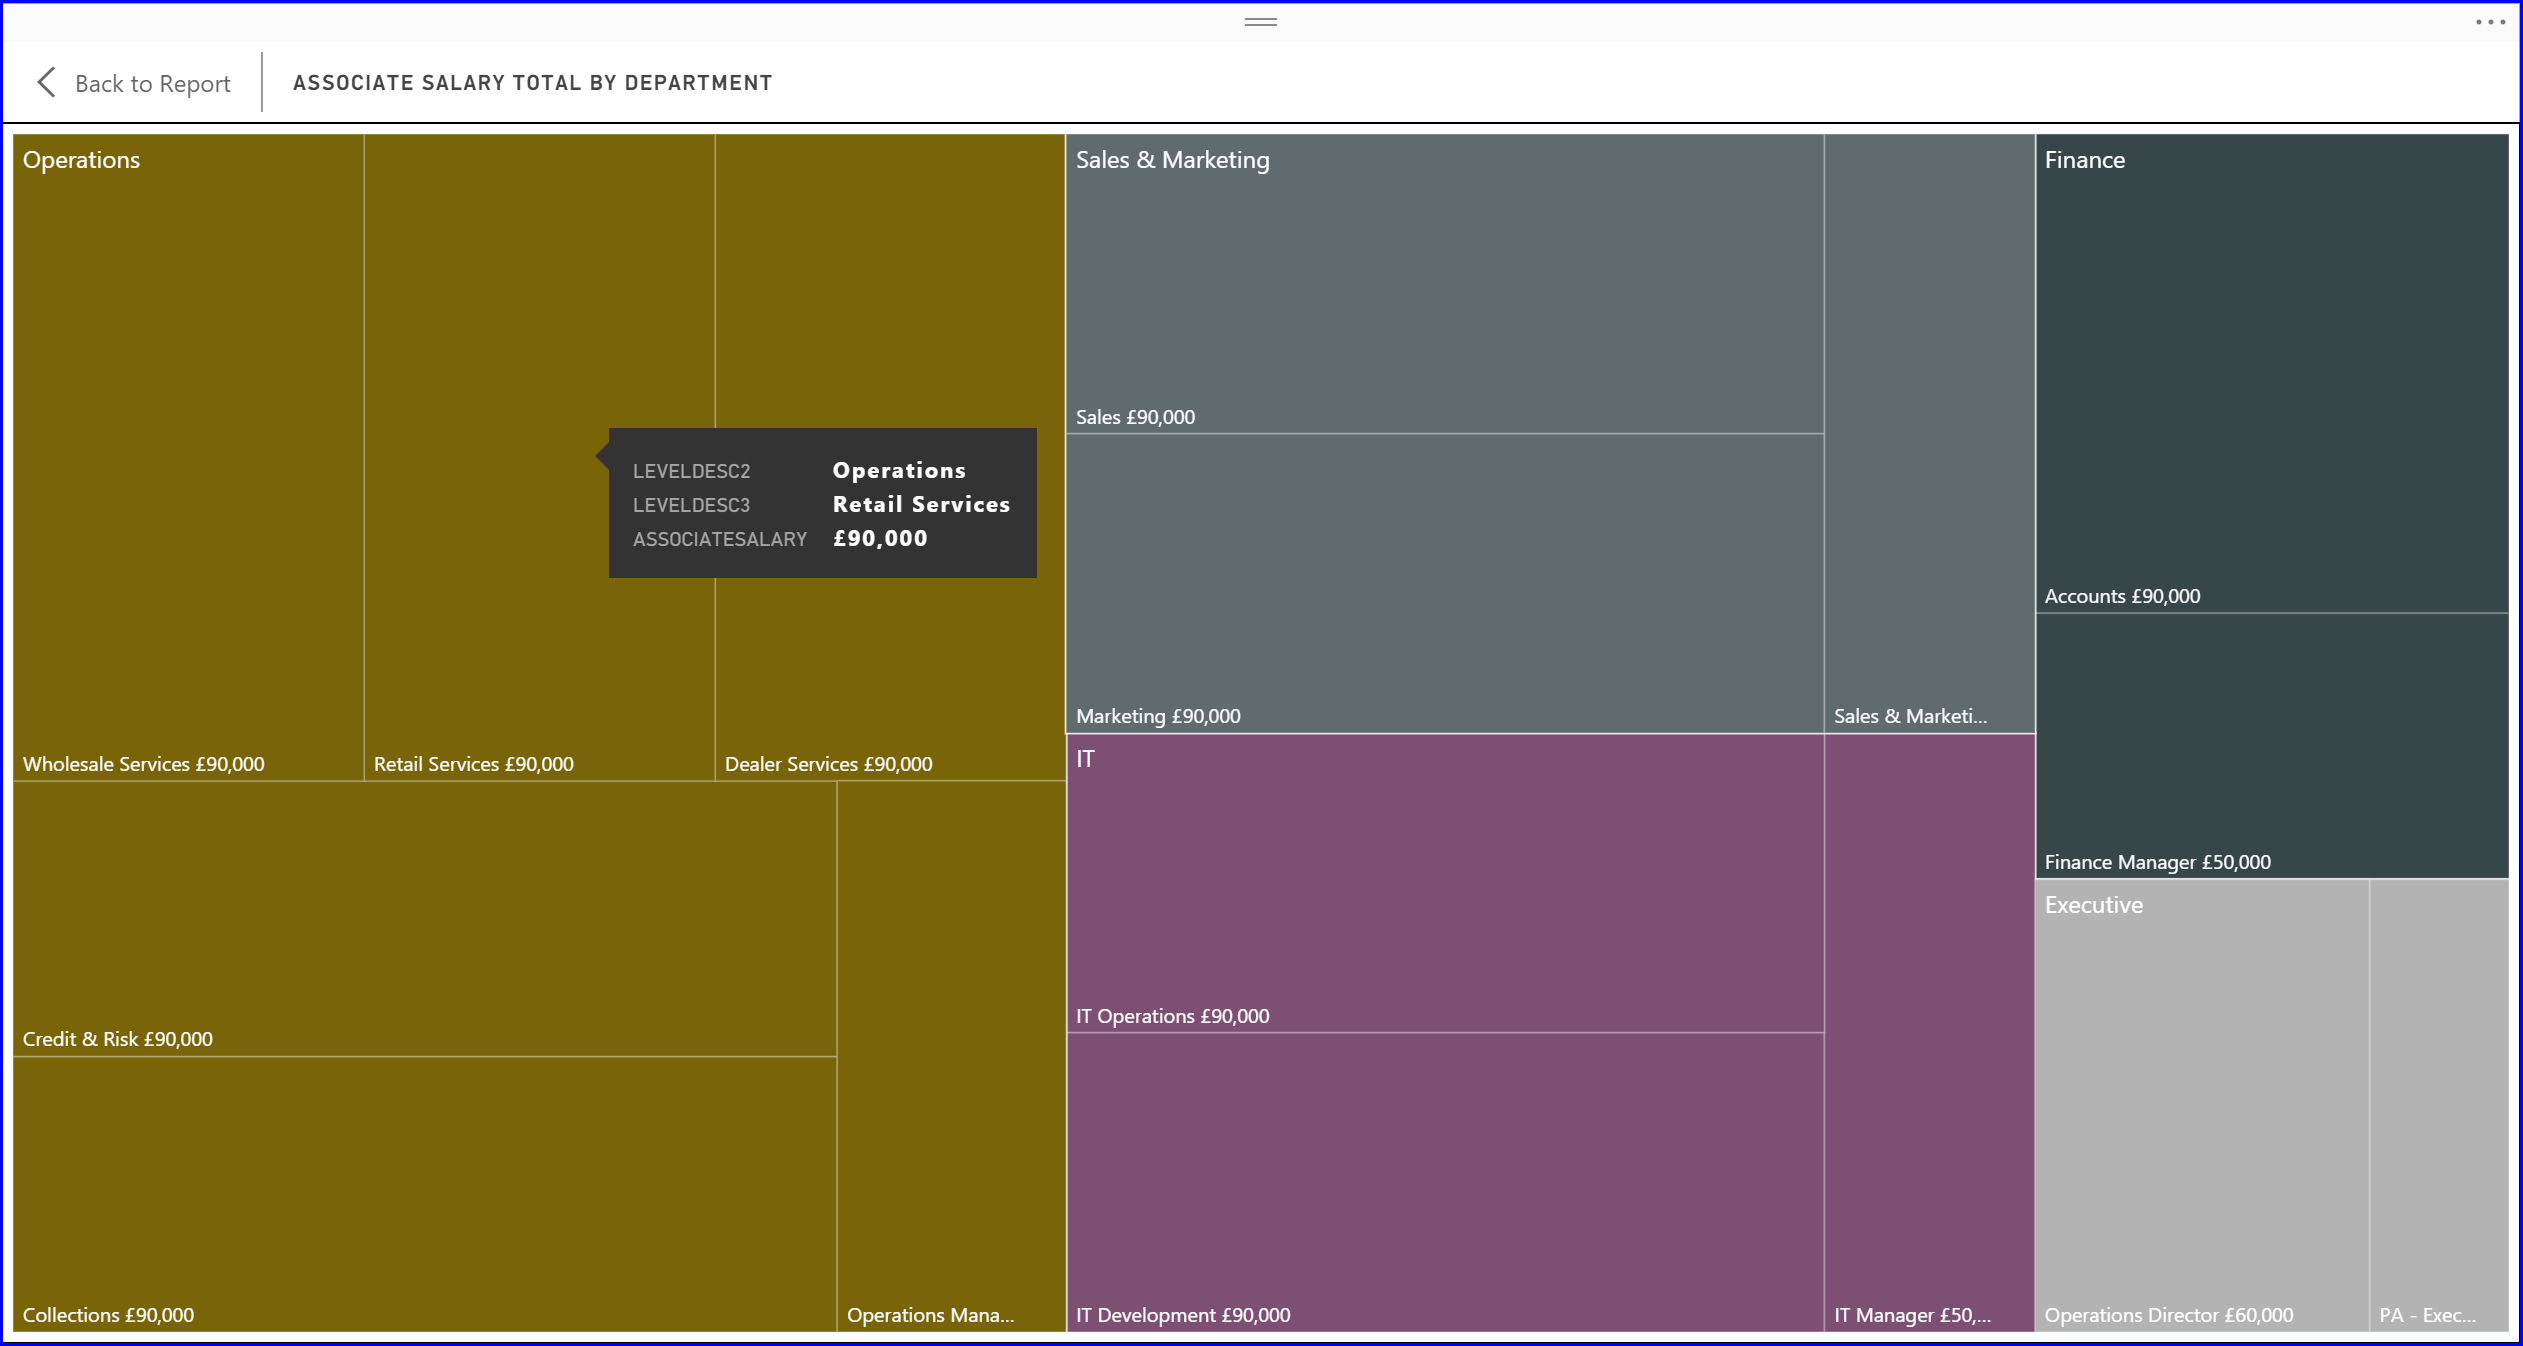
Image 6: A “Treemap” showing the Associate Salary Total by Department.
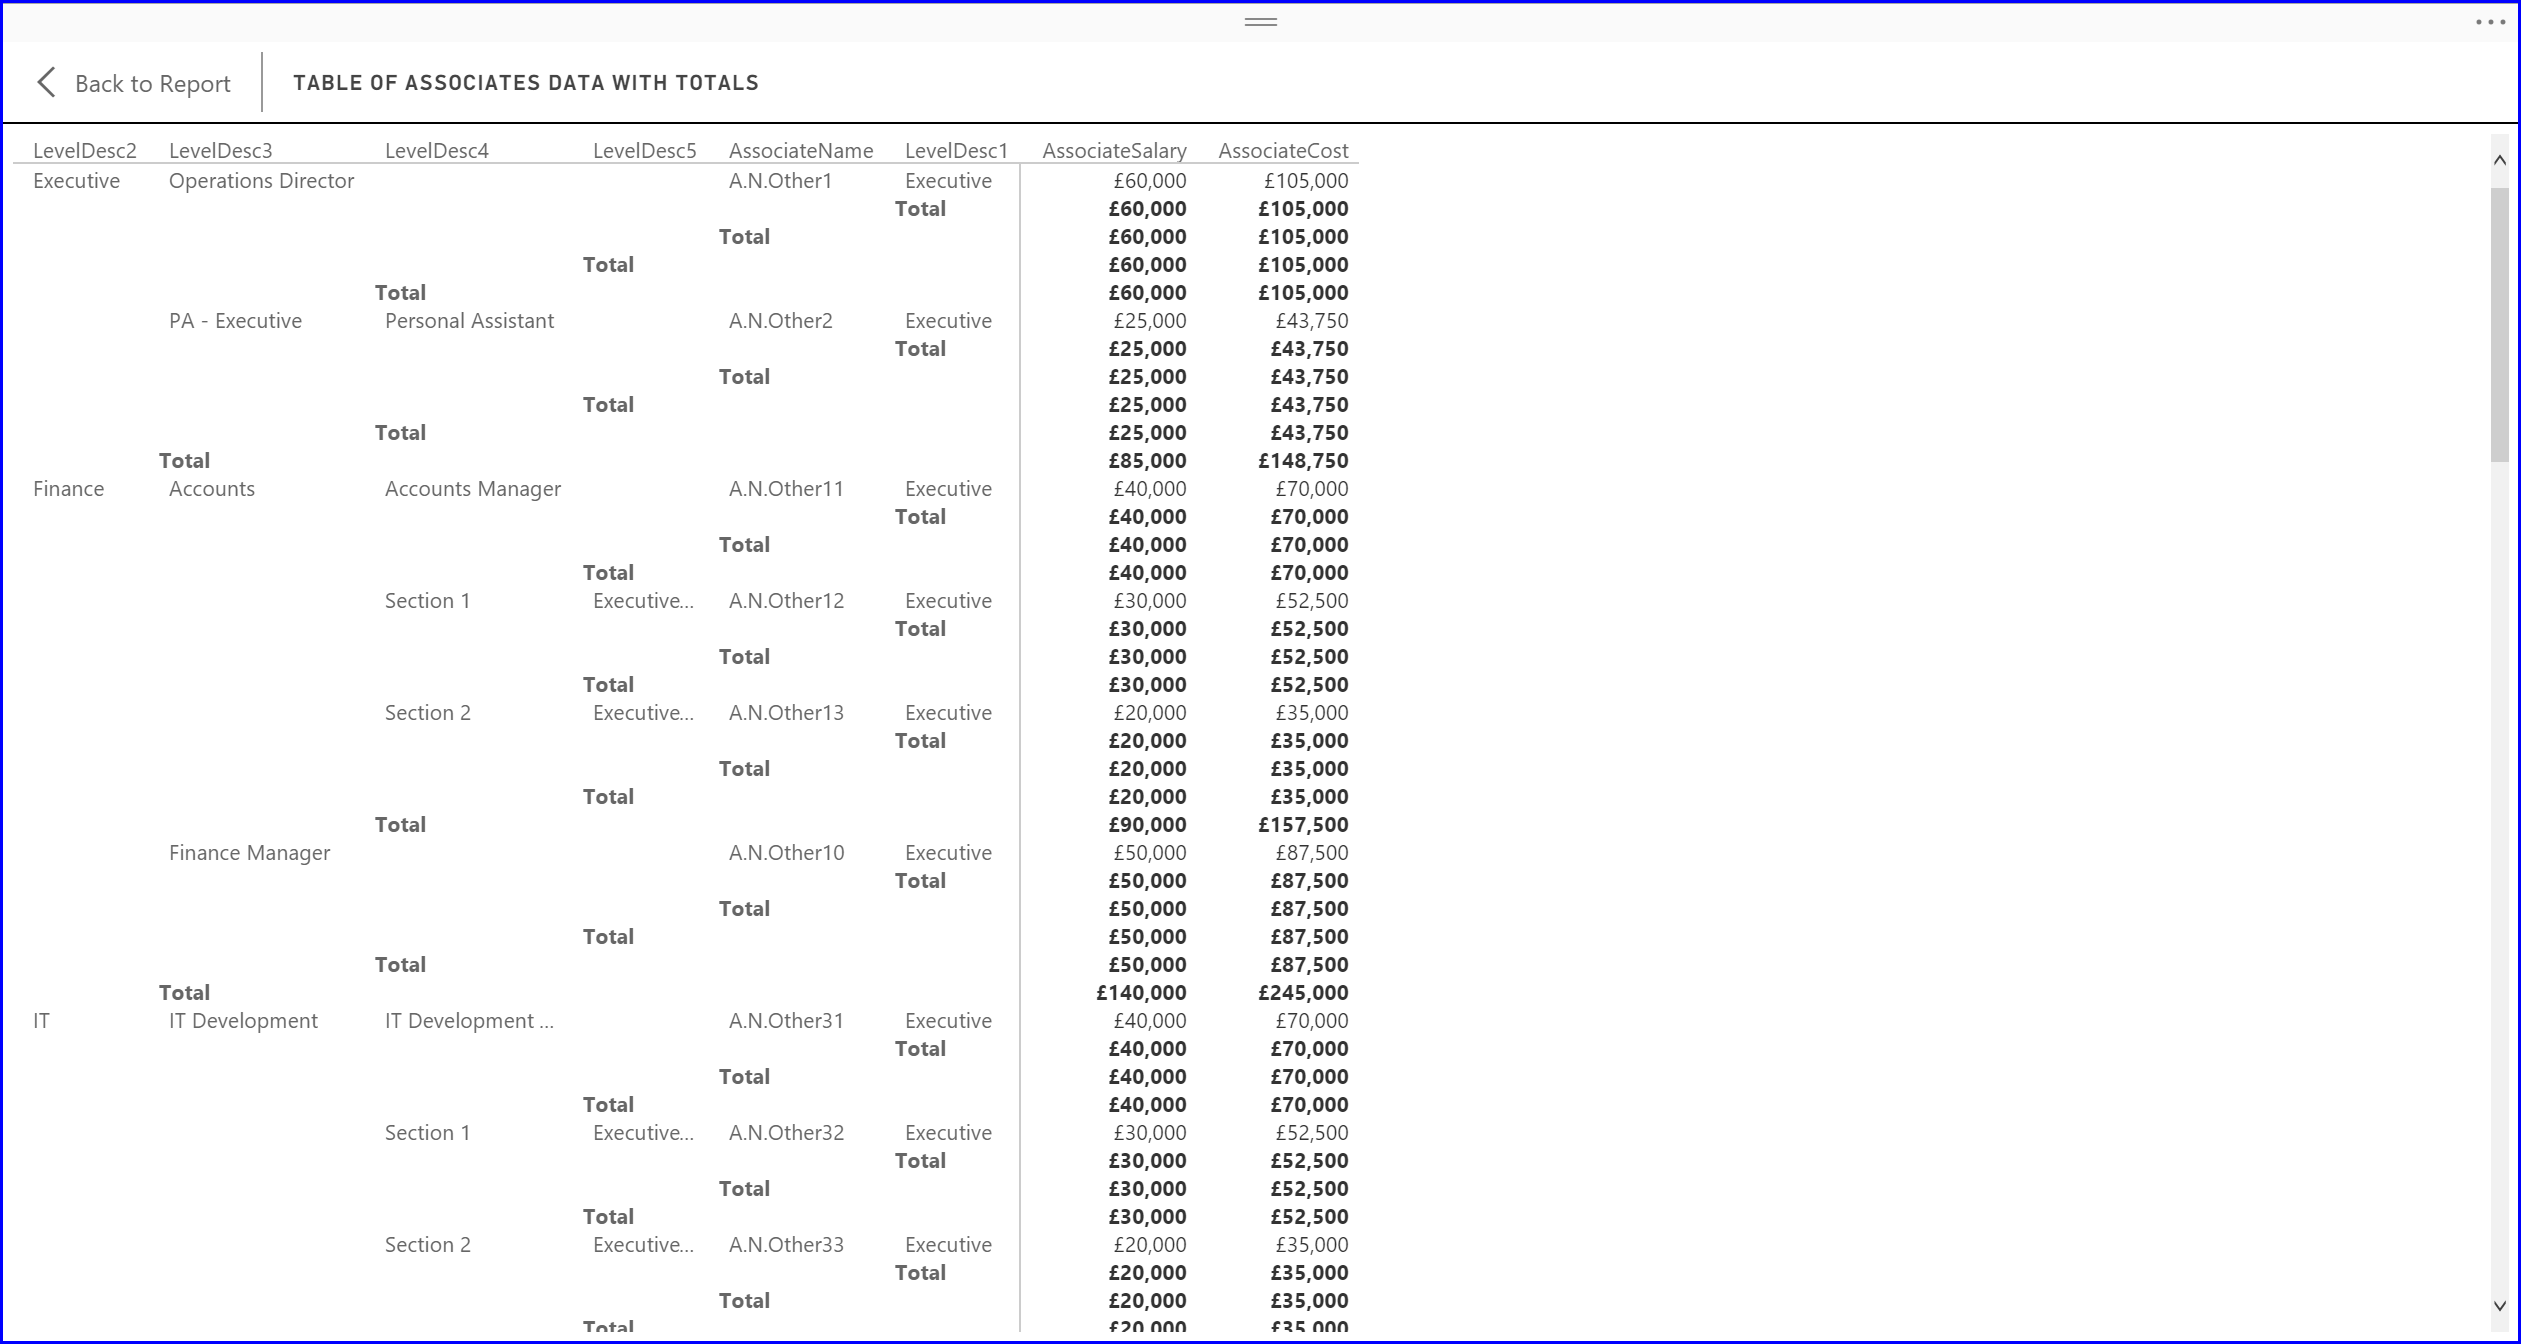
Image 7: A “Matrix Table” showing the table of Associates Data with Totals.
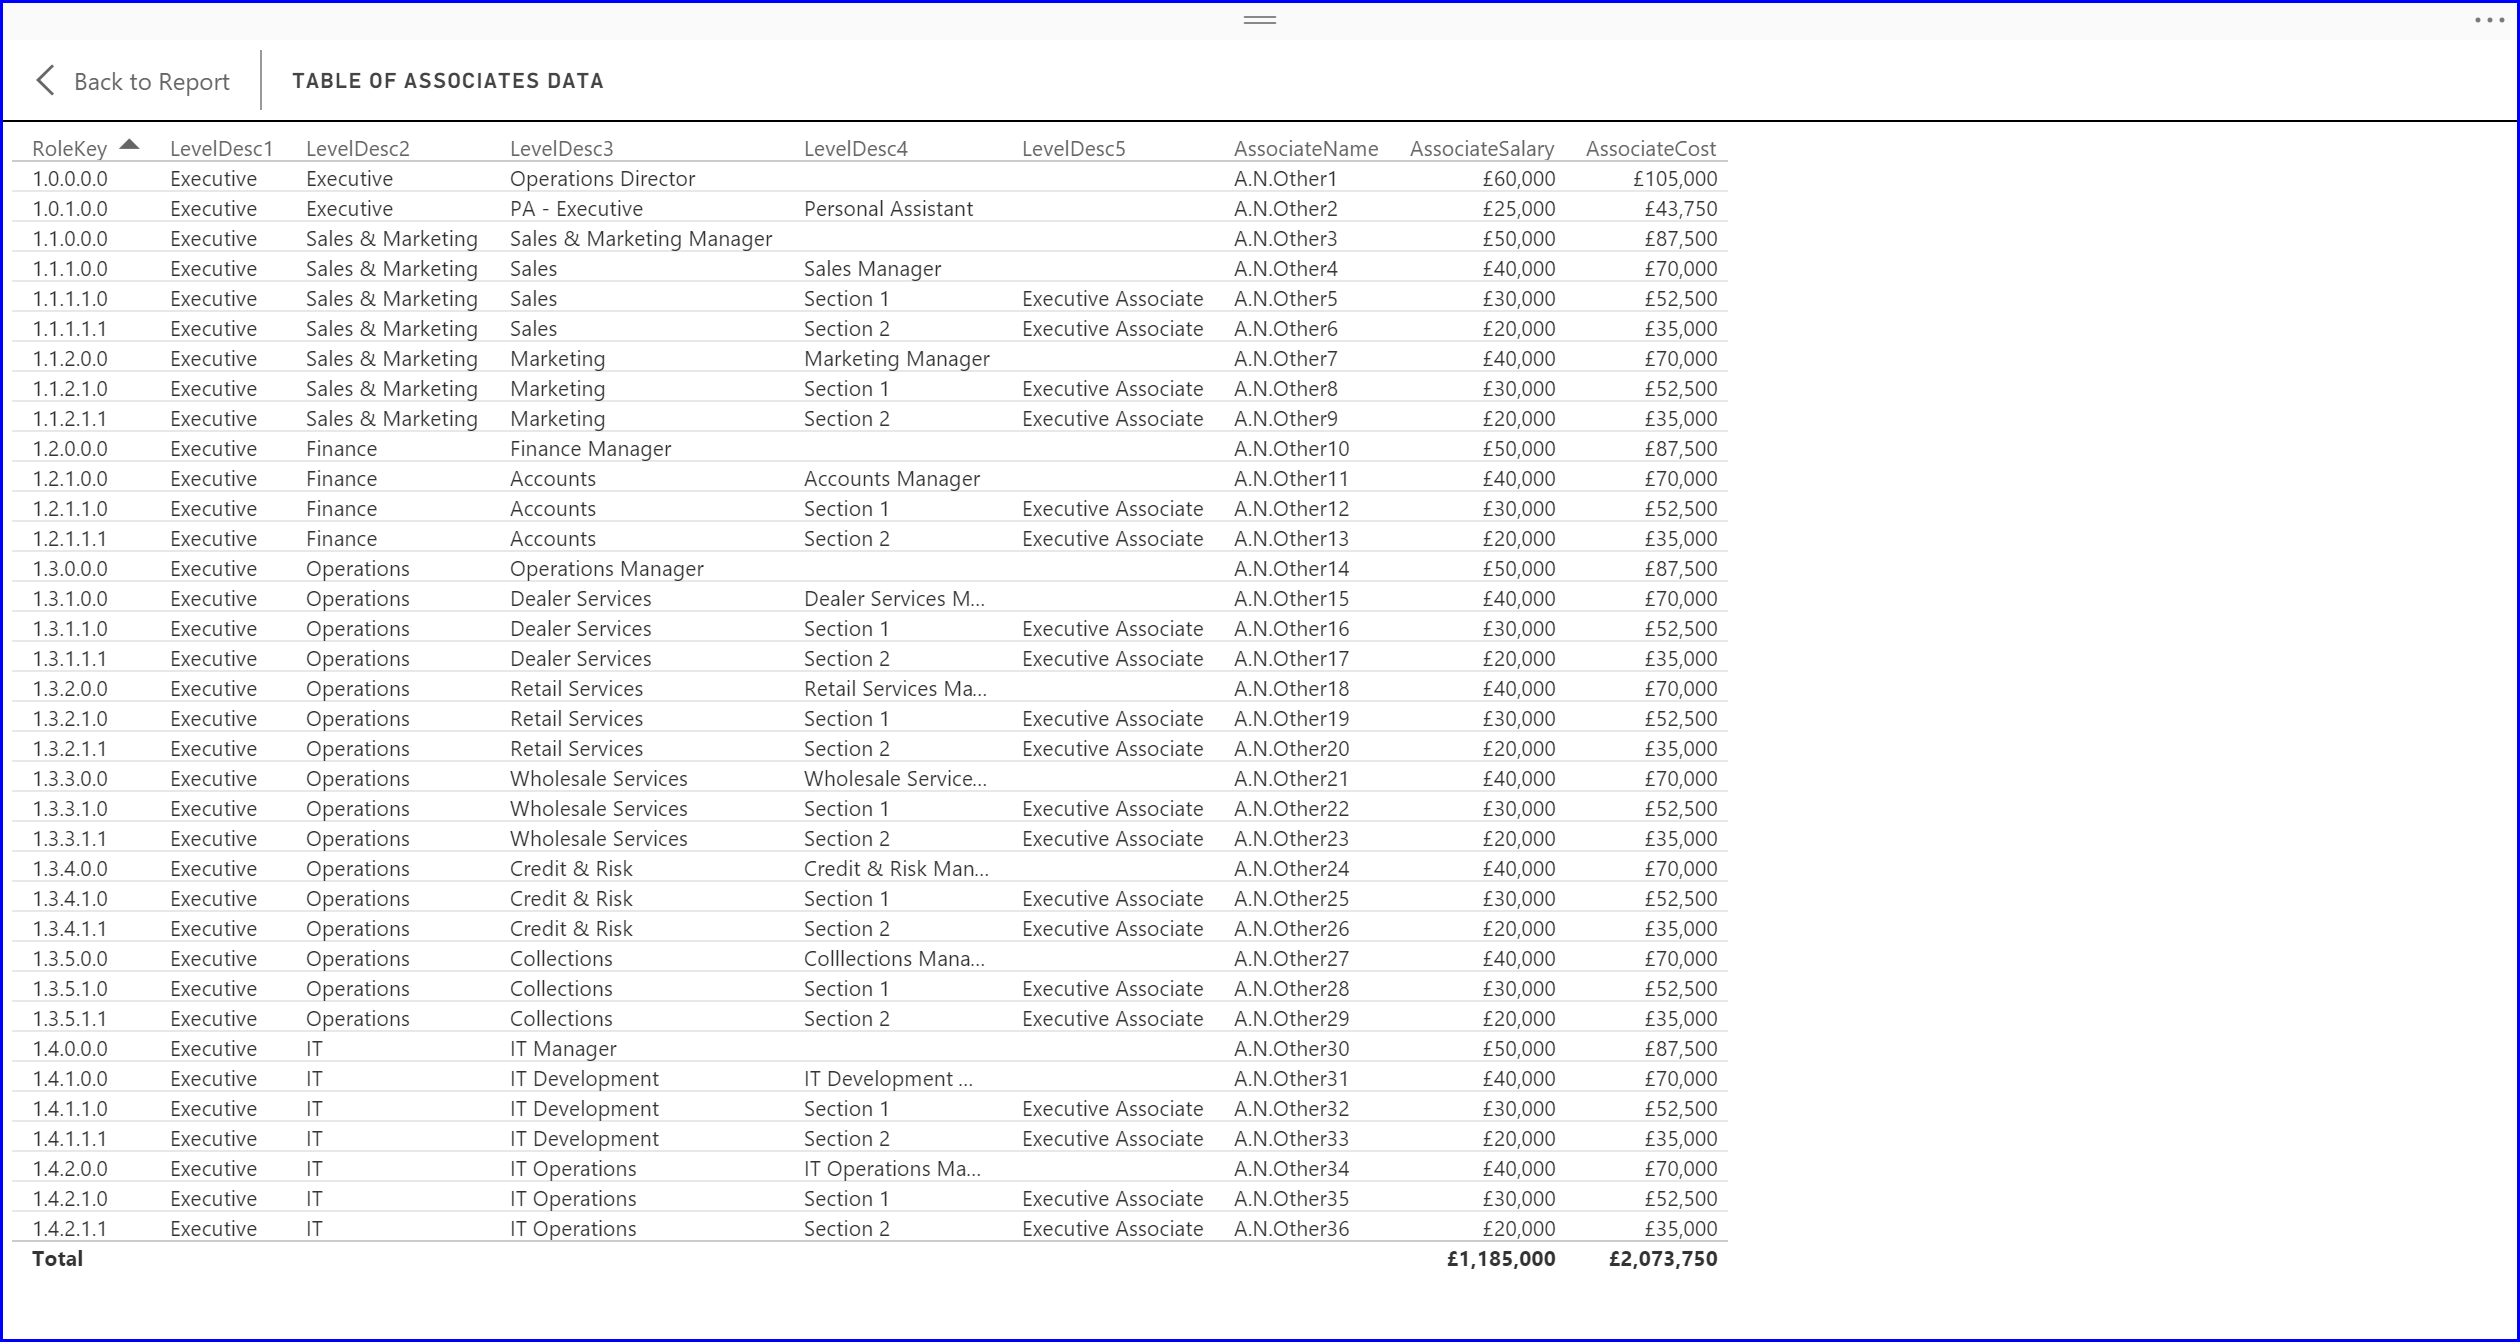
Image 8: A “Table” showing the table of Associates Data.
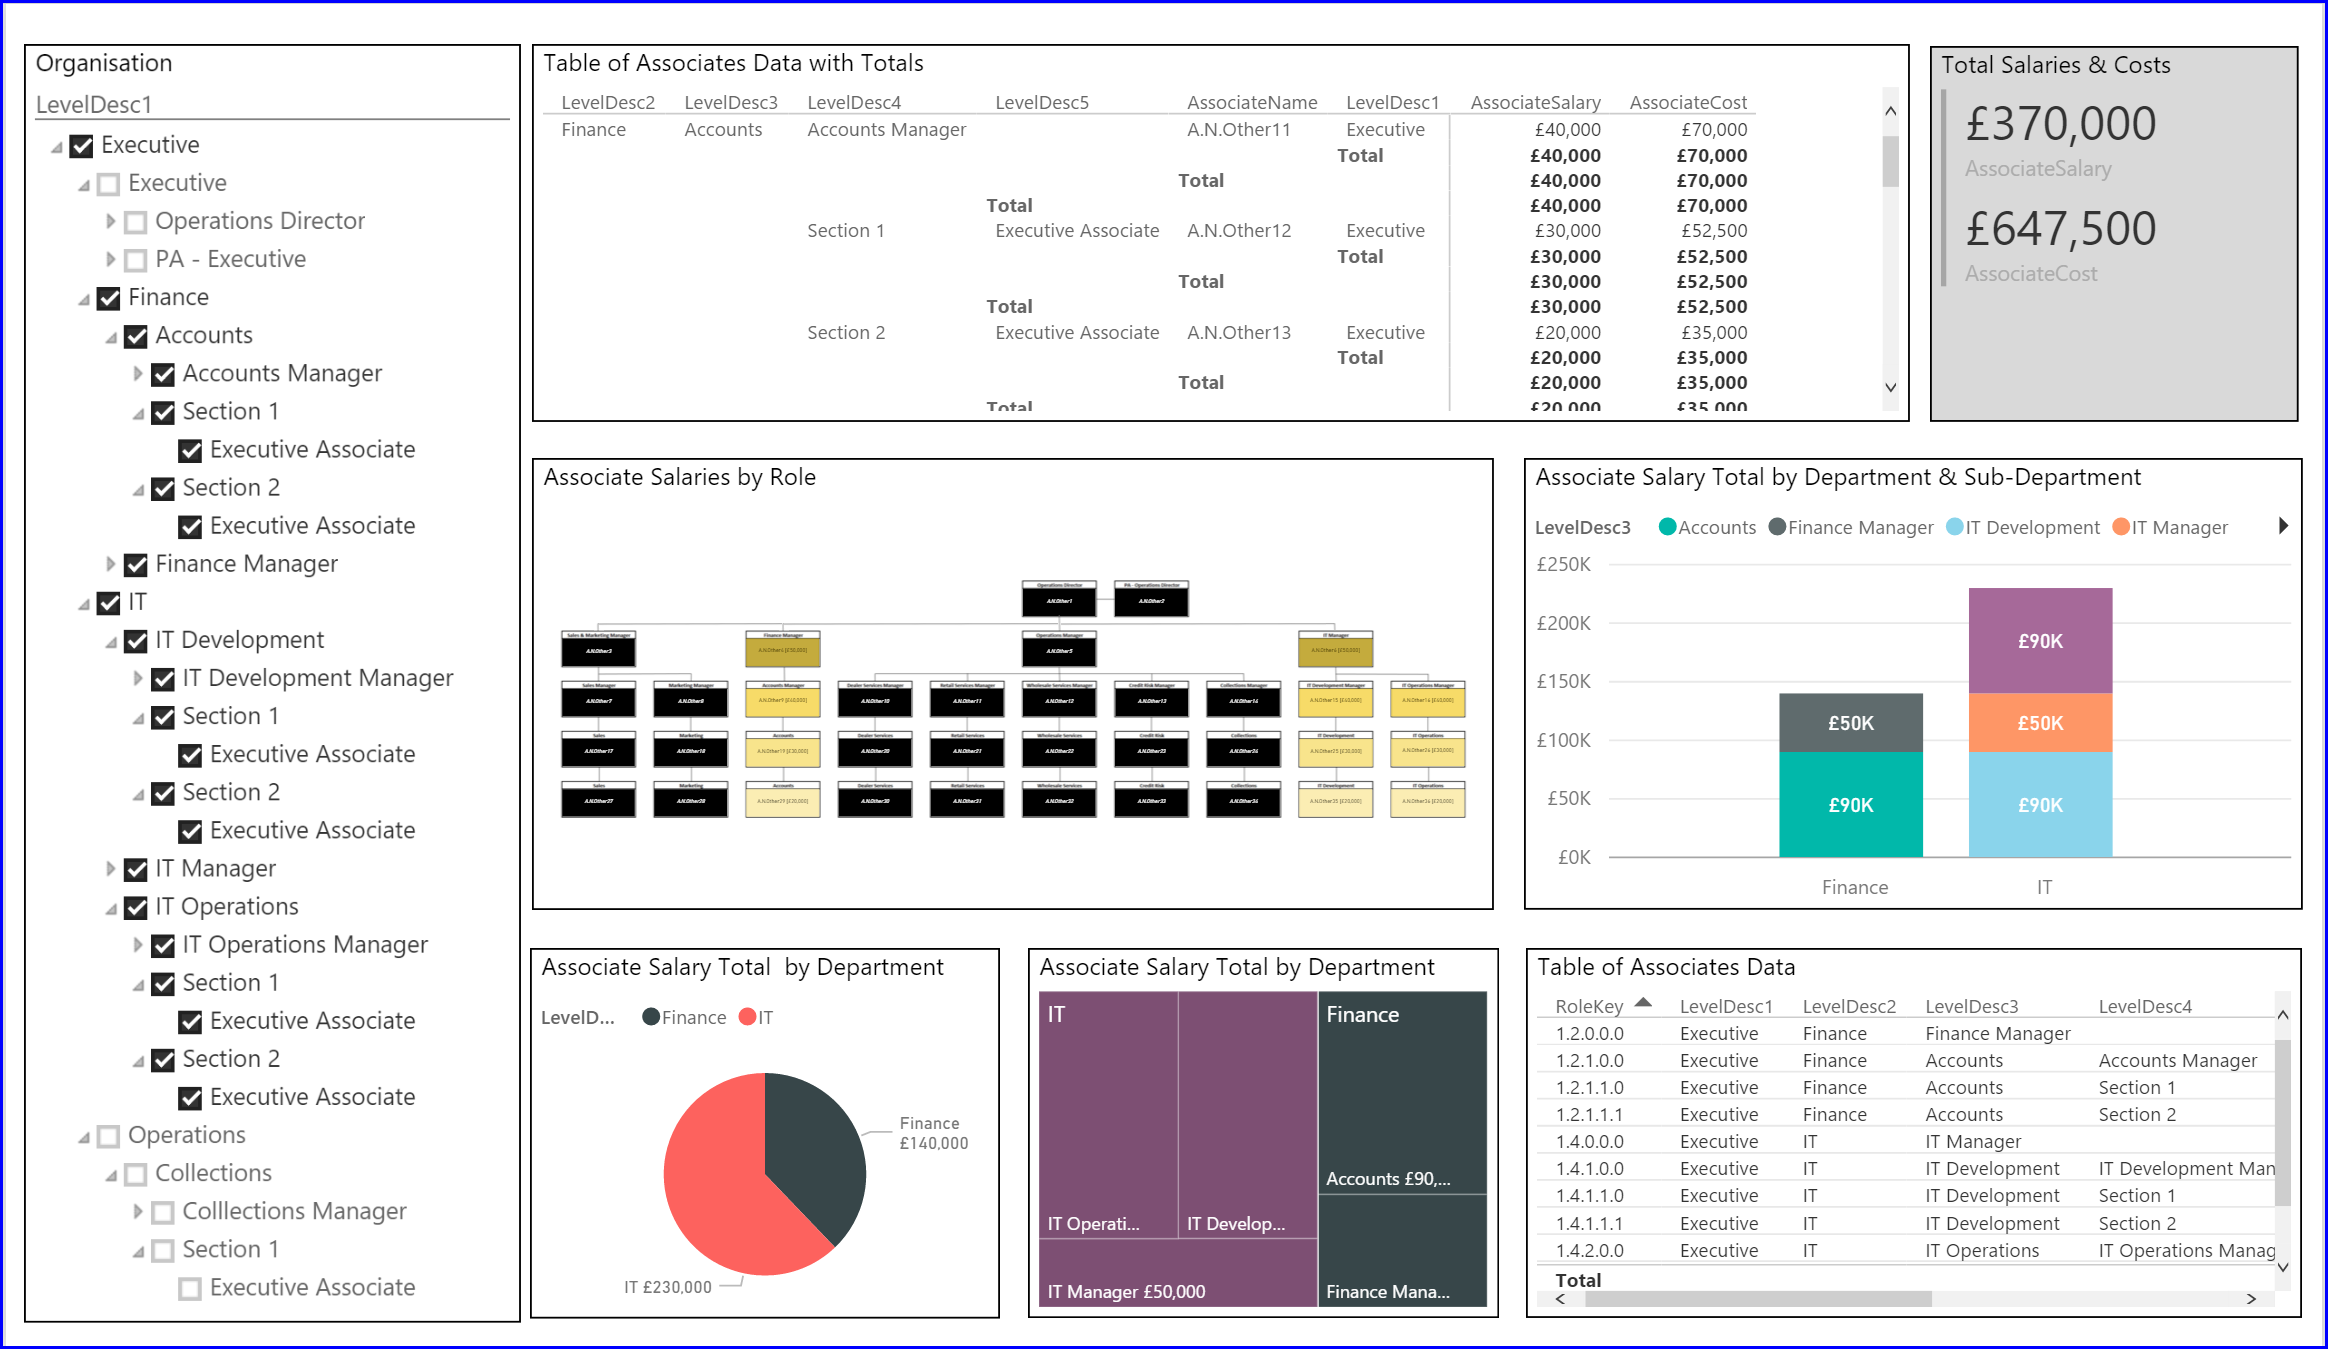
Image 9: Report showing Total Salaries and Costs for a fictitious organisation. All the visualisations are filtered by the selections in the “Hierarchy Slicer”.
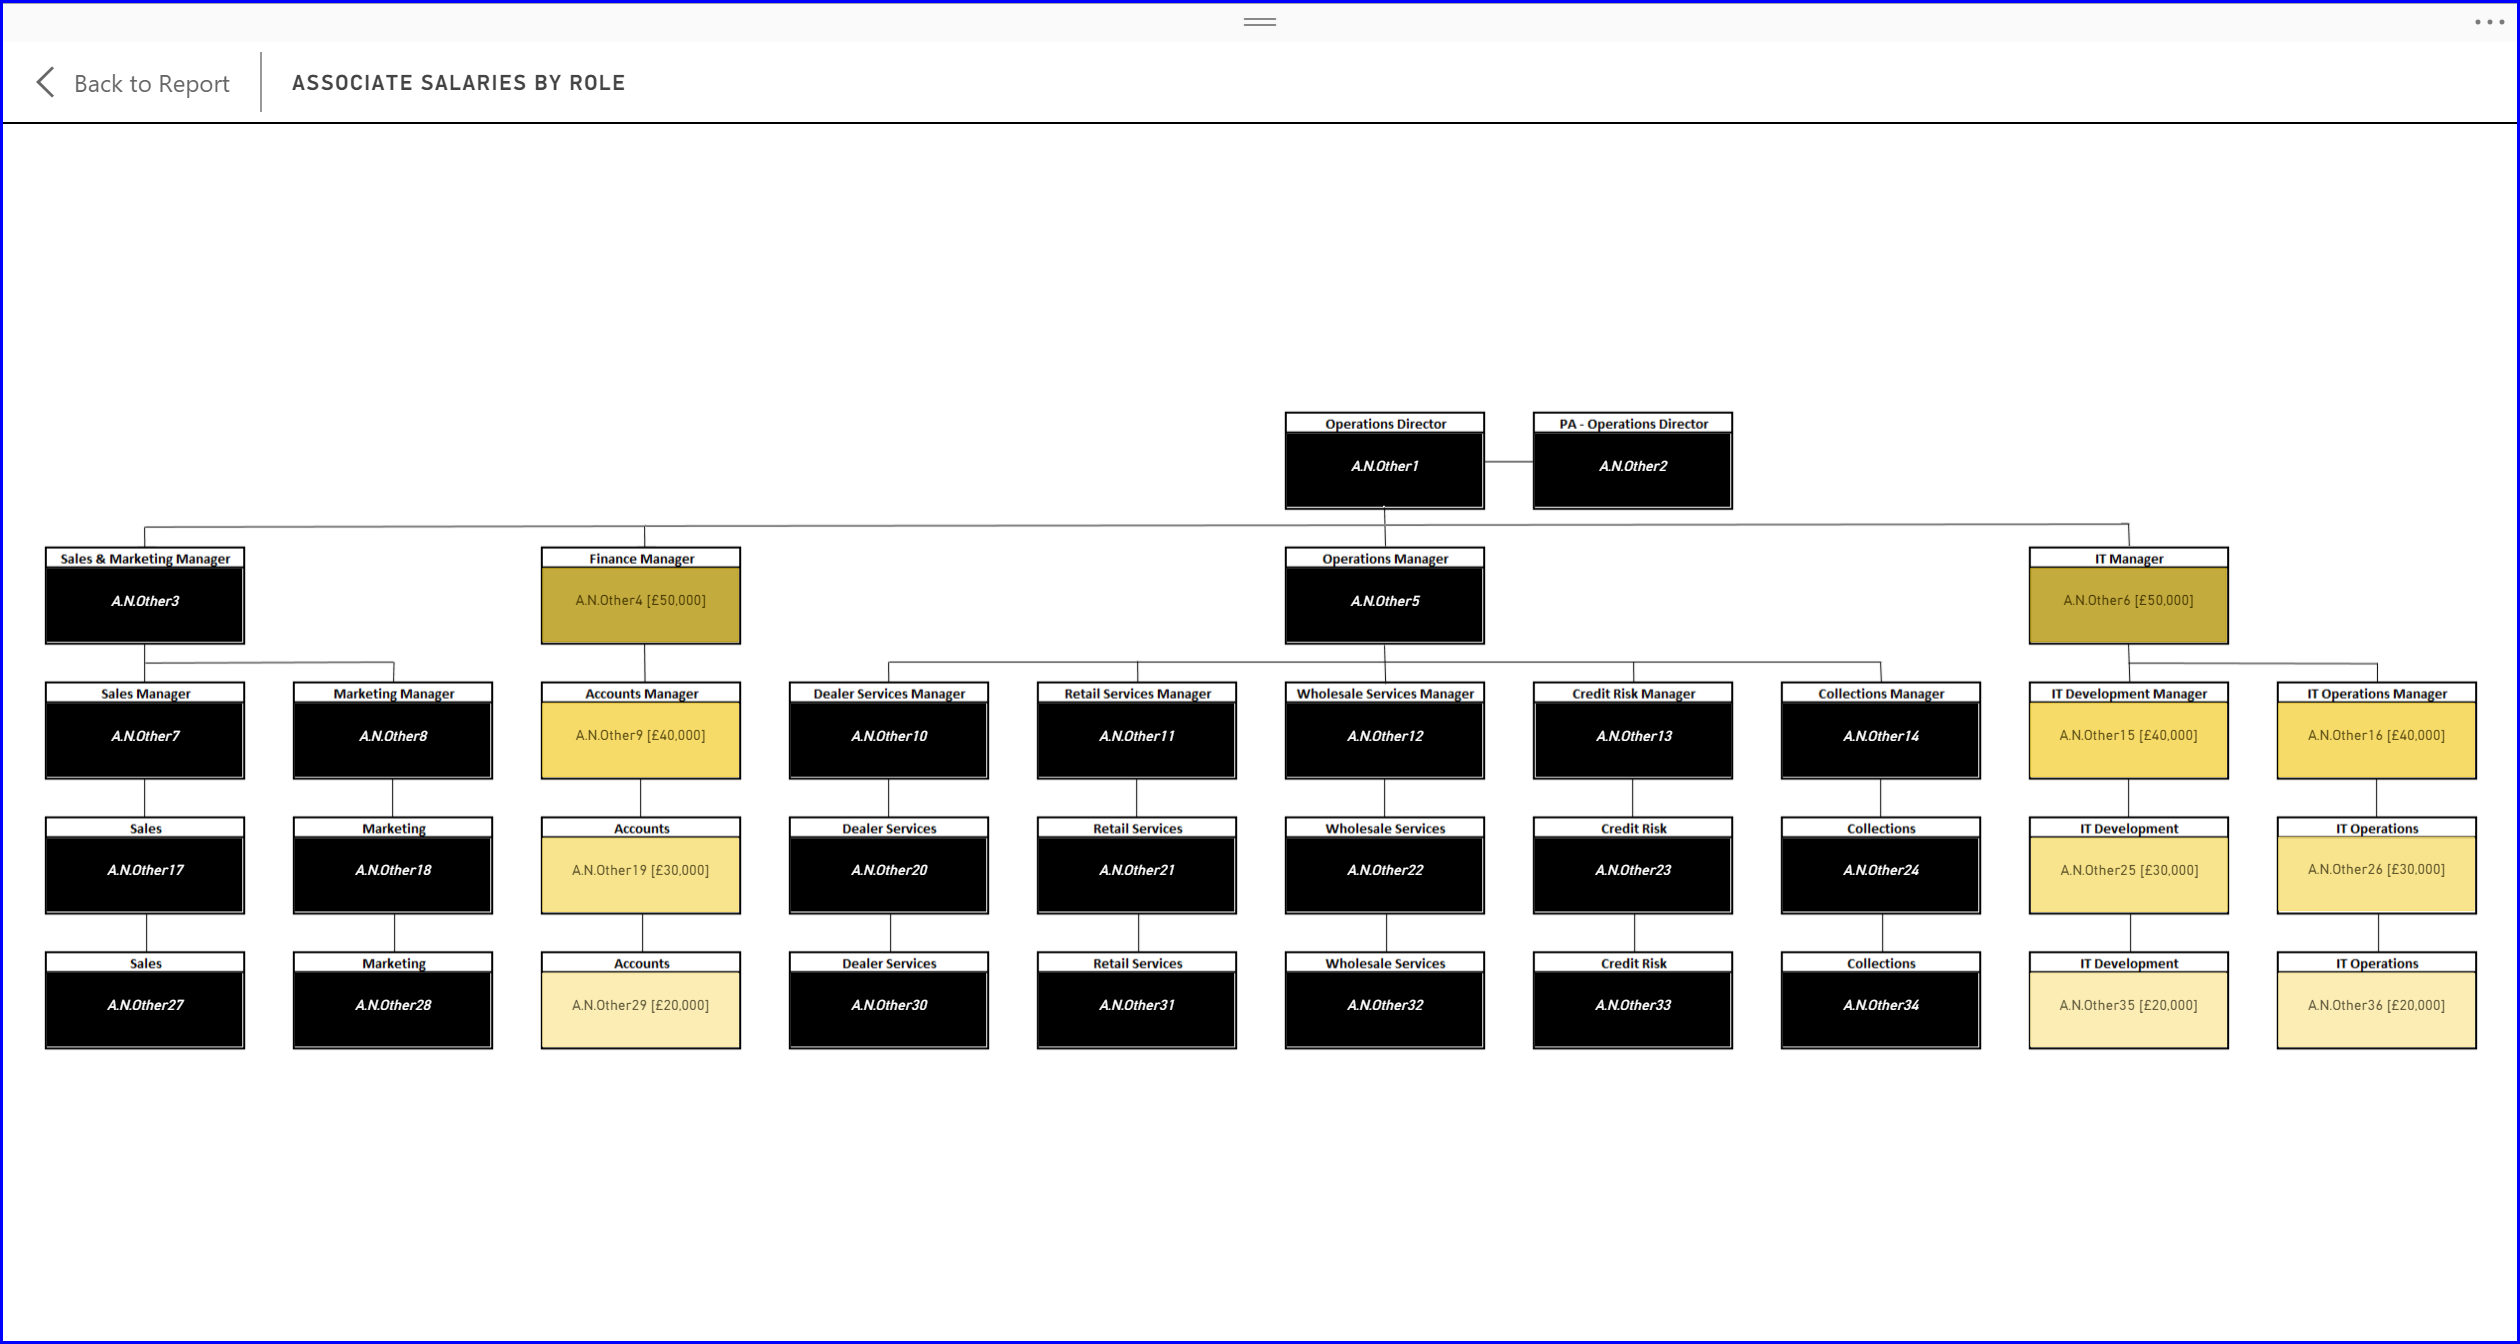
Image 10: The Organisation Chart reflecting the filtering by the selections in the “Hierarchy Slicer”.

Image 11: The Organisation Chart that has been created using Microsoft Visio Pro that is exported as a “.png” file which can then be uploaded to the “SYNOPTIC DESIGNER FOR POWER BI” at the web address, http://synoptic.design/.
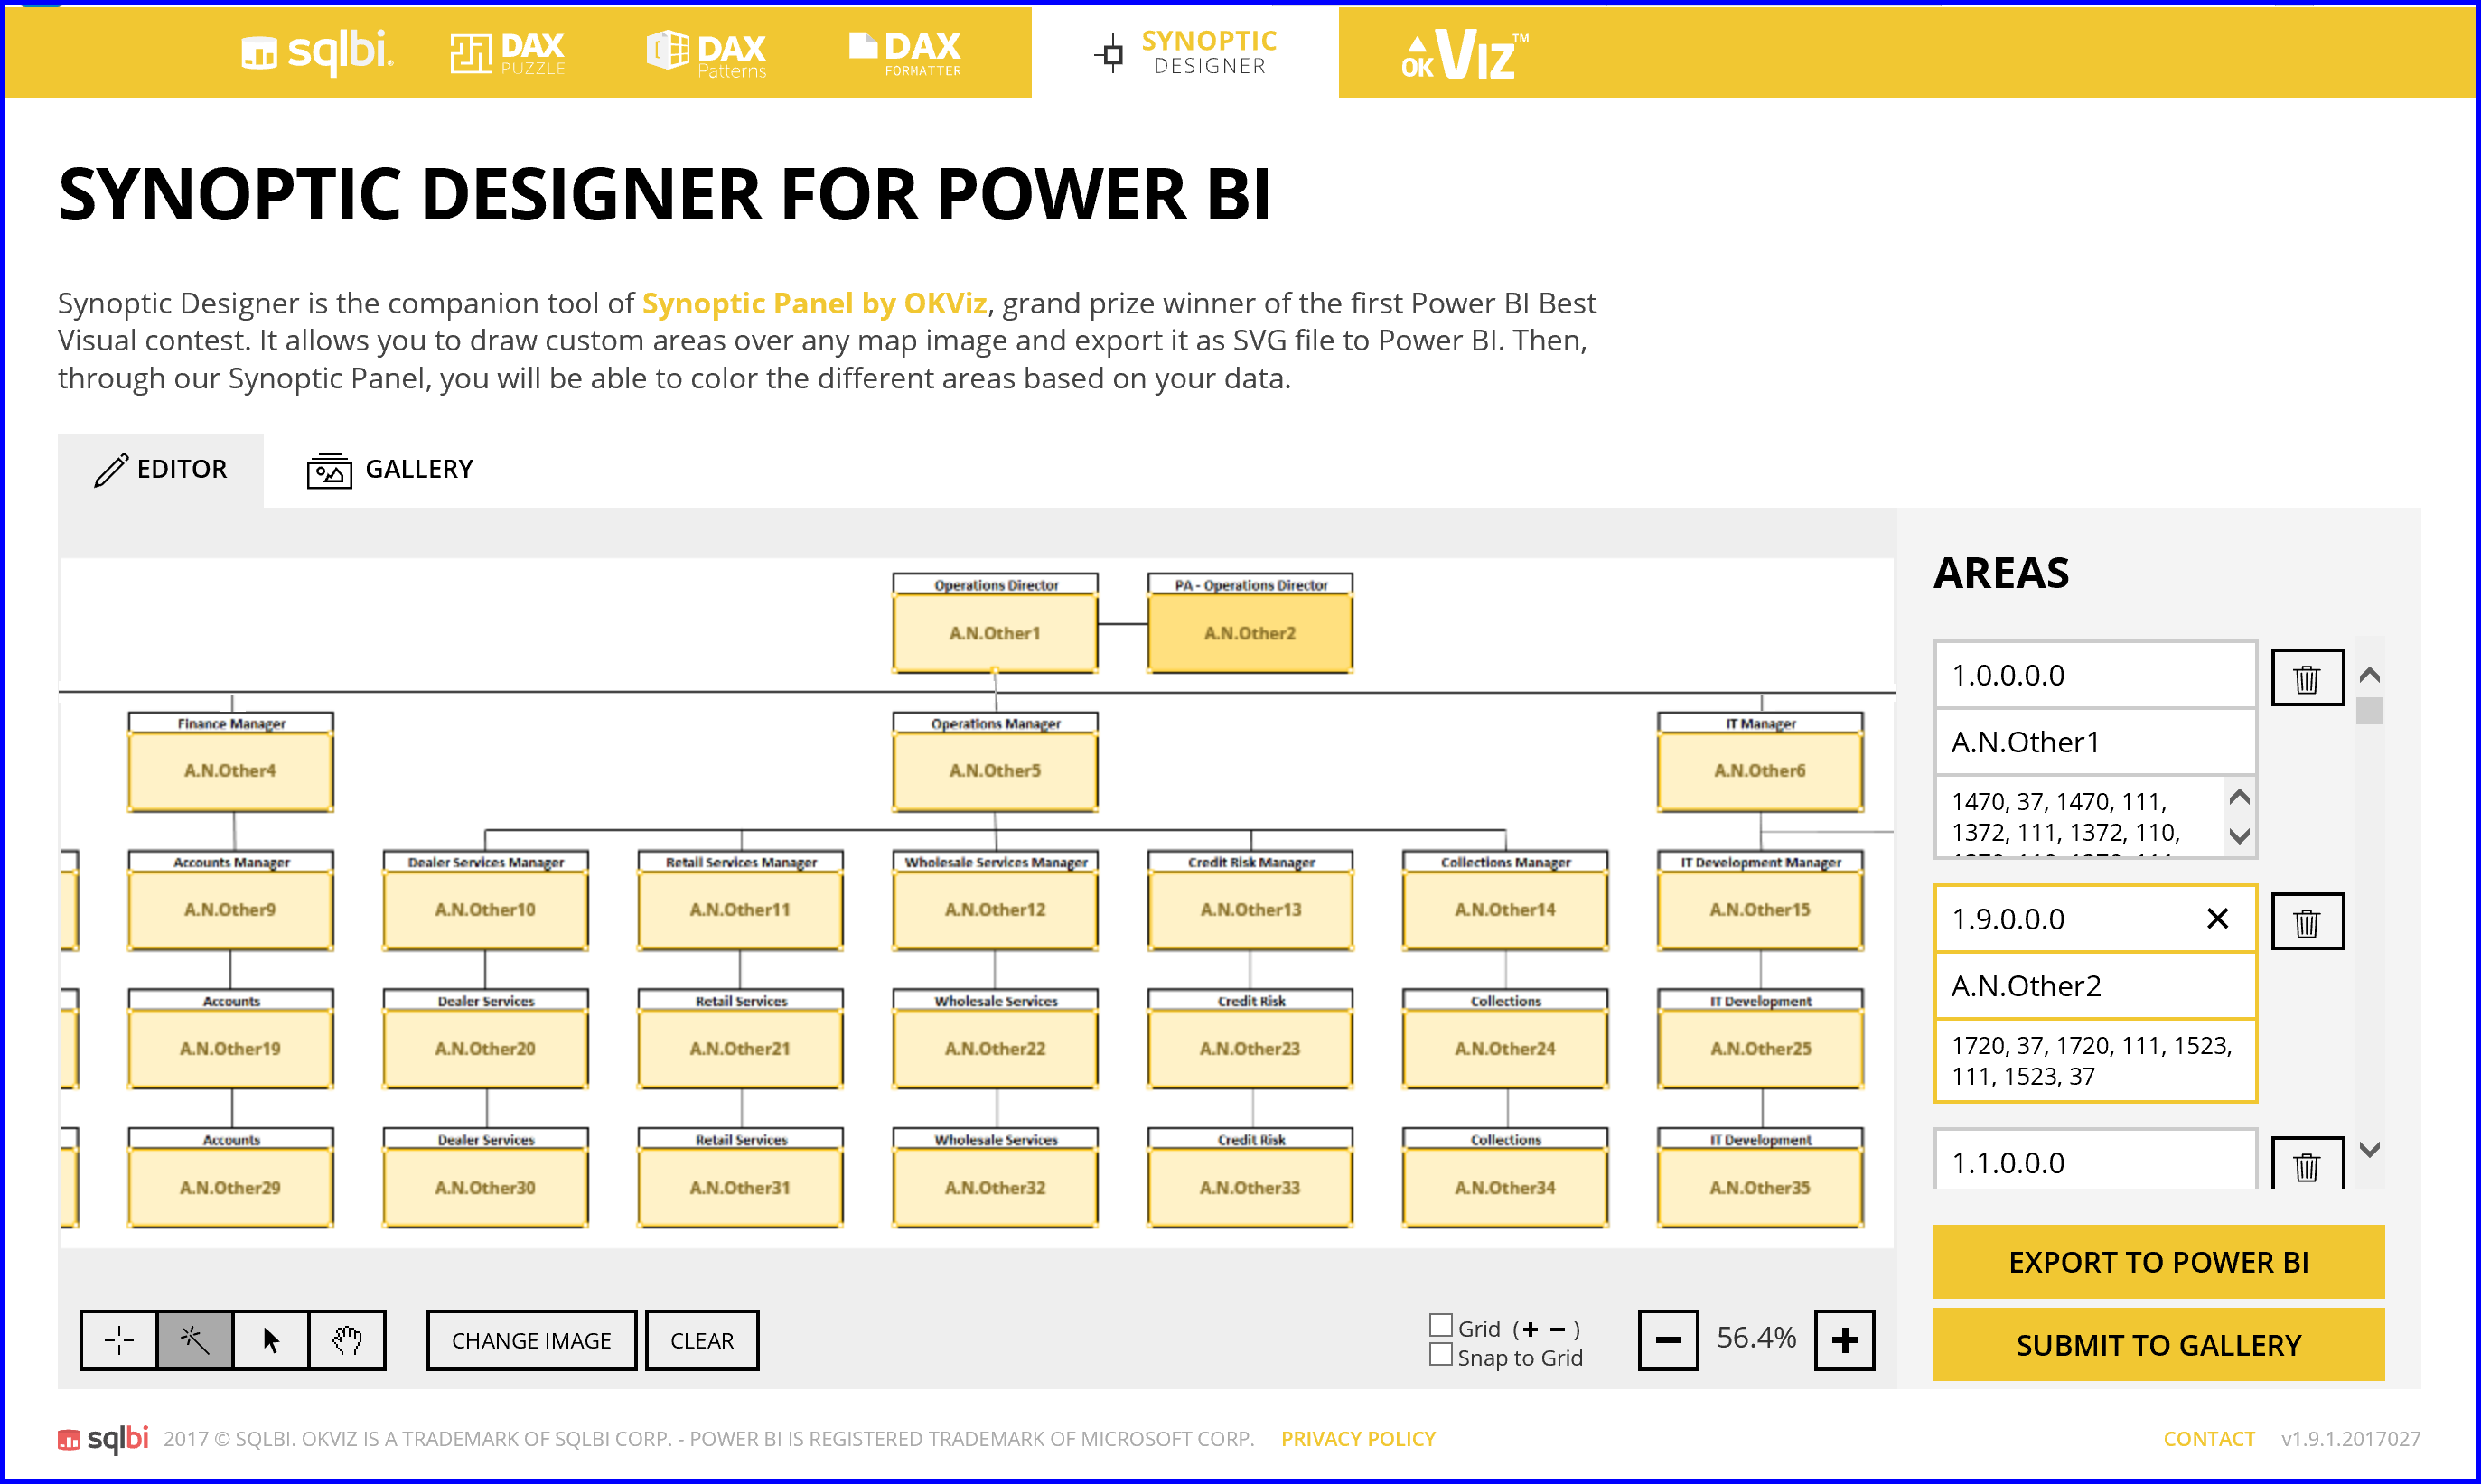
Image 12: The Organisation Chart that has been uploaded to the “SYNOPTIC DESIGNER FOR POWER BI” at the web address, http://synoptic.design/ before being exported as a “.svg” for use in the “Synoptic Panel by OKViz” custom visual.
Here’s hoping that this was of interest. If you have any questions feel free to contact me at fred.williams@insightfuldatasolutions.com