Power BI – Visualisation – Calendar
I am very impressed by the “Calendar” custom visual created by Andy Cross (@andyelastacloud) but having spent some time experimenting with the excellent “Synoptic Panel by OKViz” custom visualisation I missed the ability to define up to 5 states for the calendar data and also wanted to have the visualisation look more like a calendar.
I therefore decided to develop my own approach to display data on calendars as I had some time to spare and wanted to experiment with Power BI.
Following is a description of my first attempt
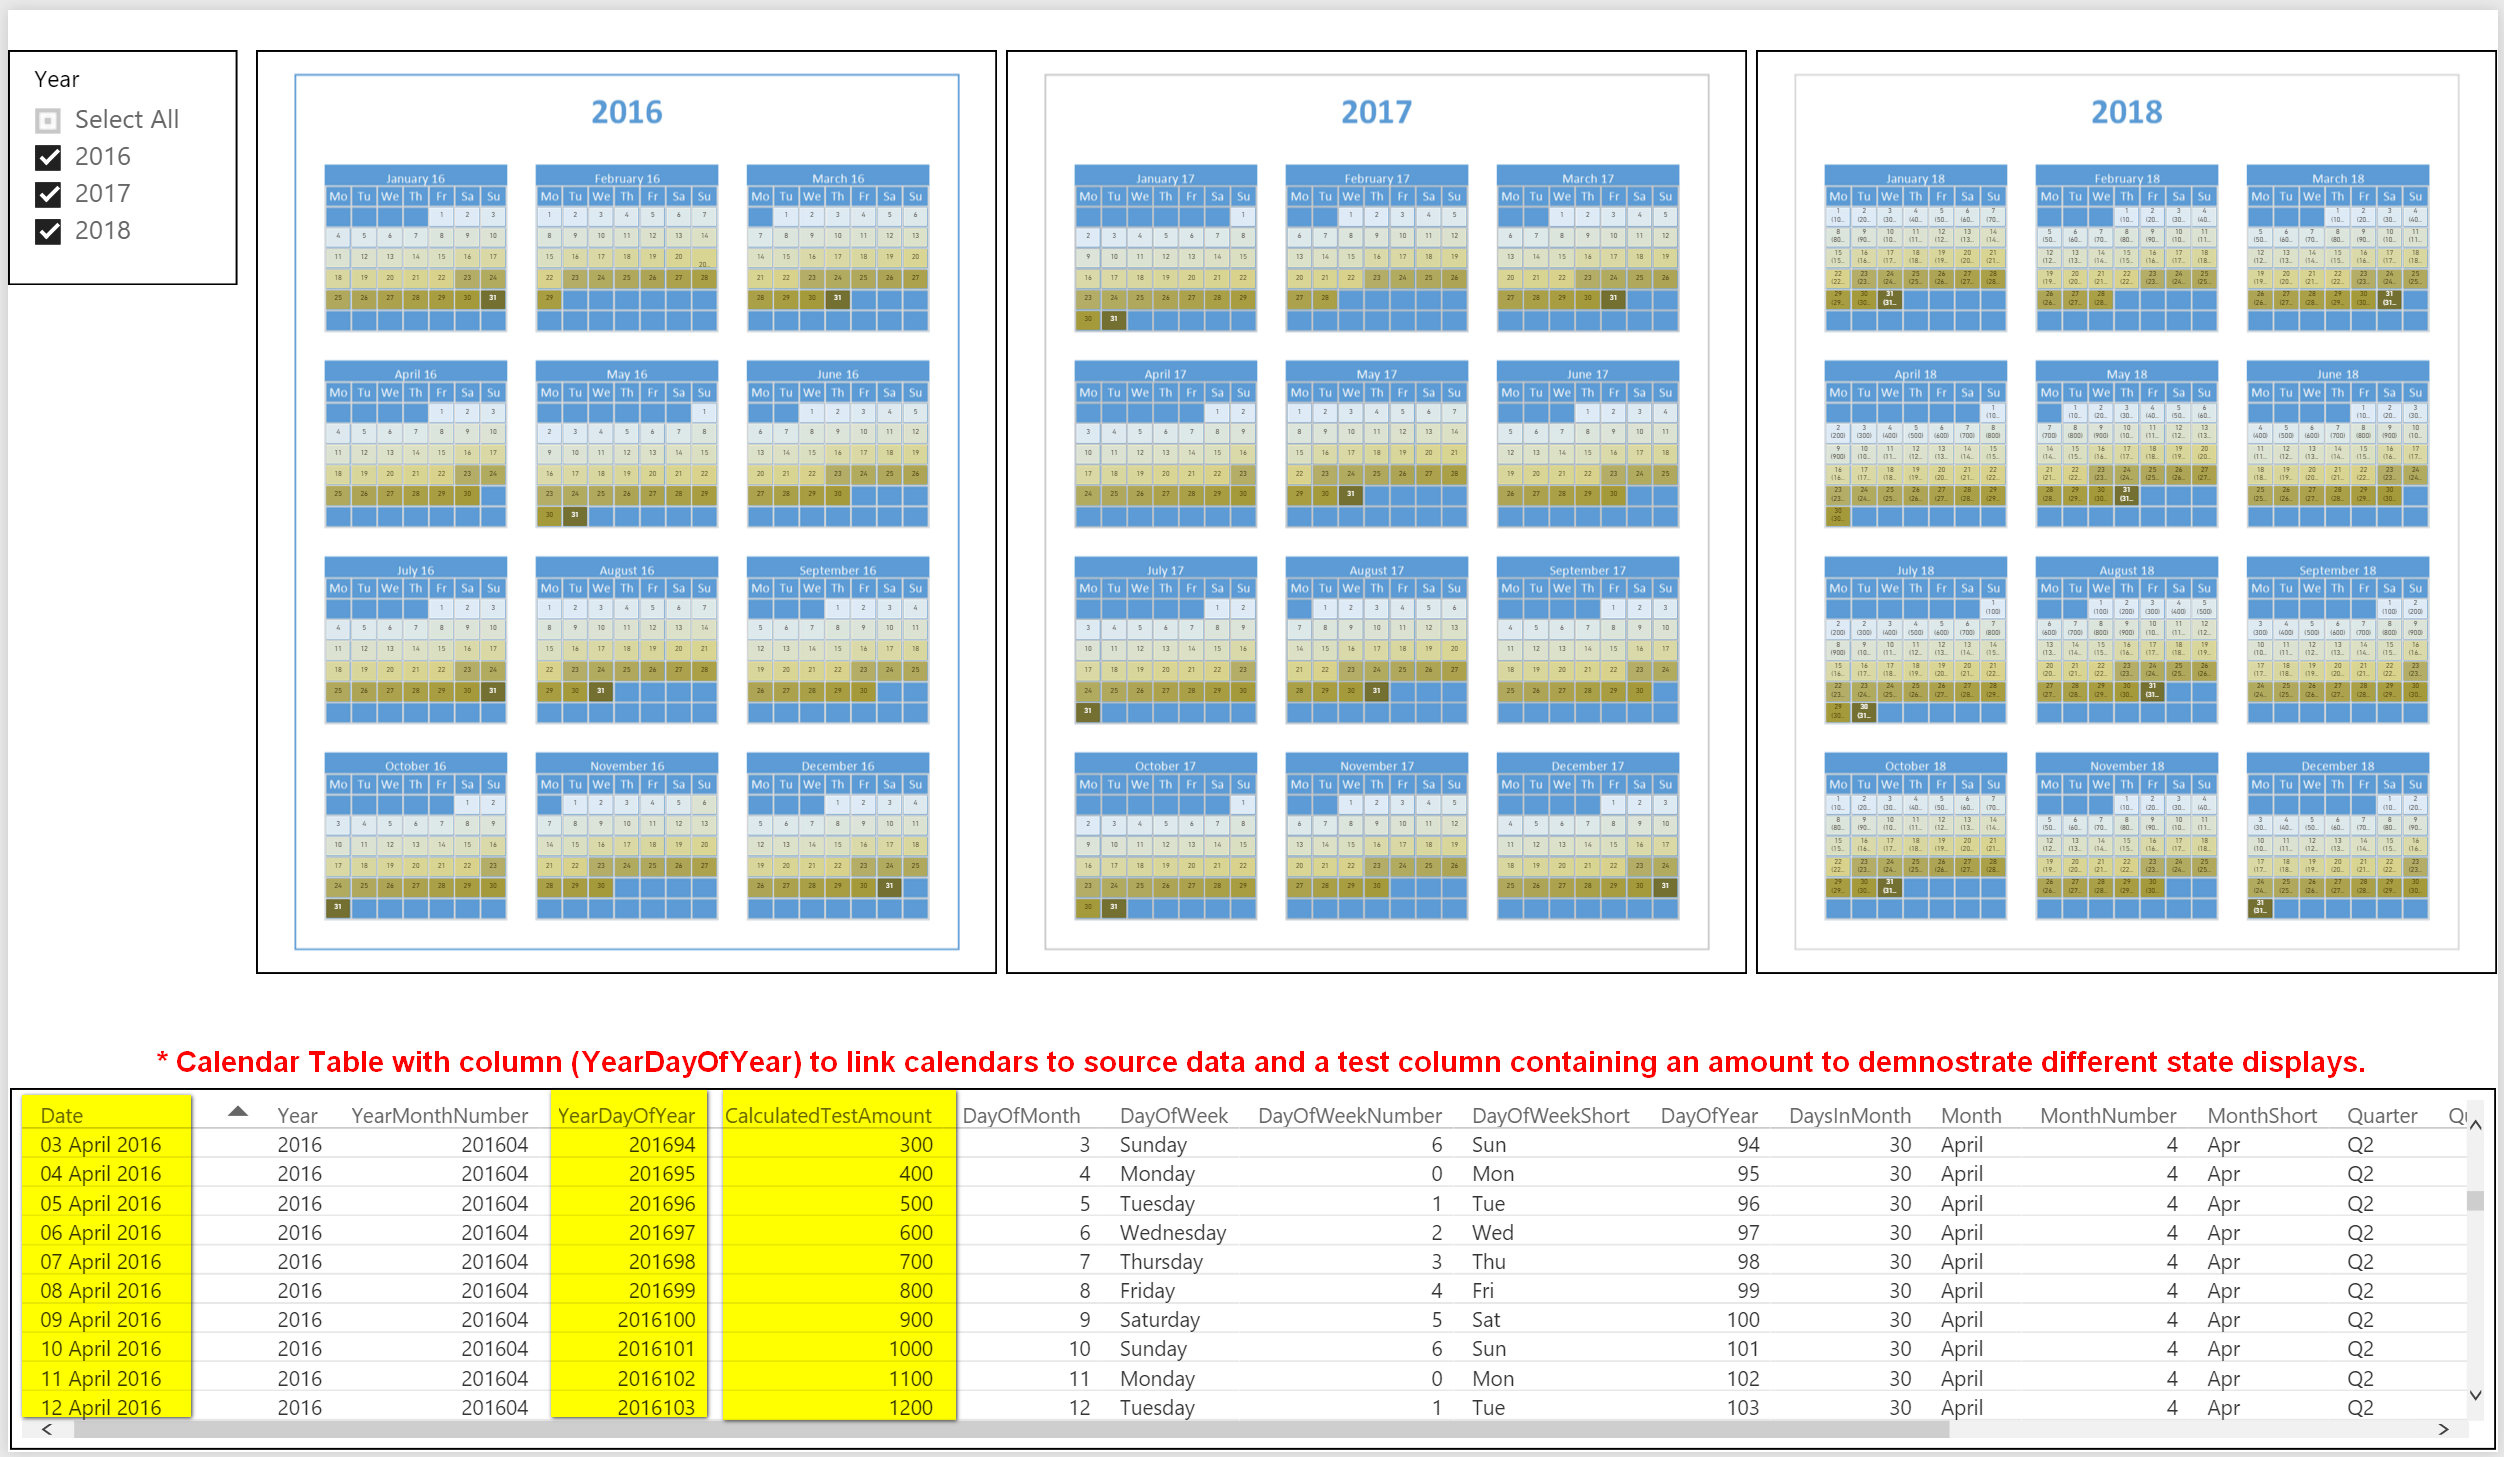
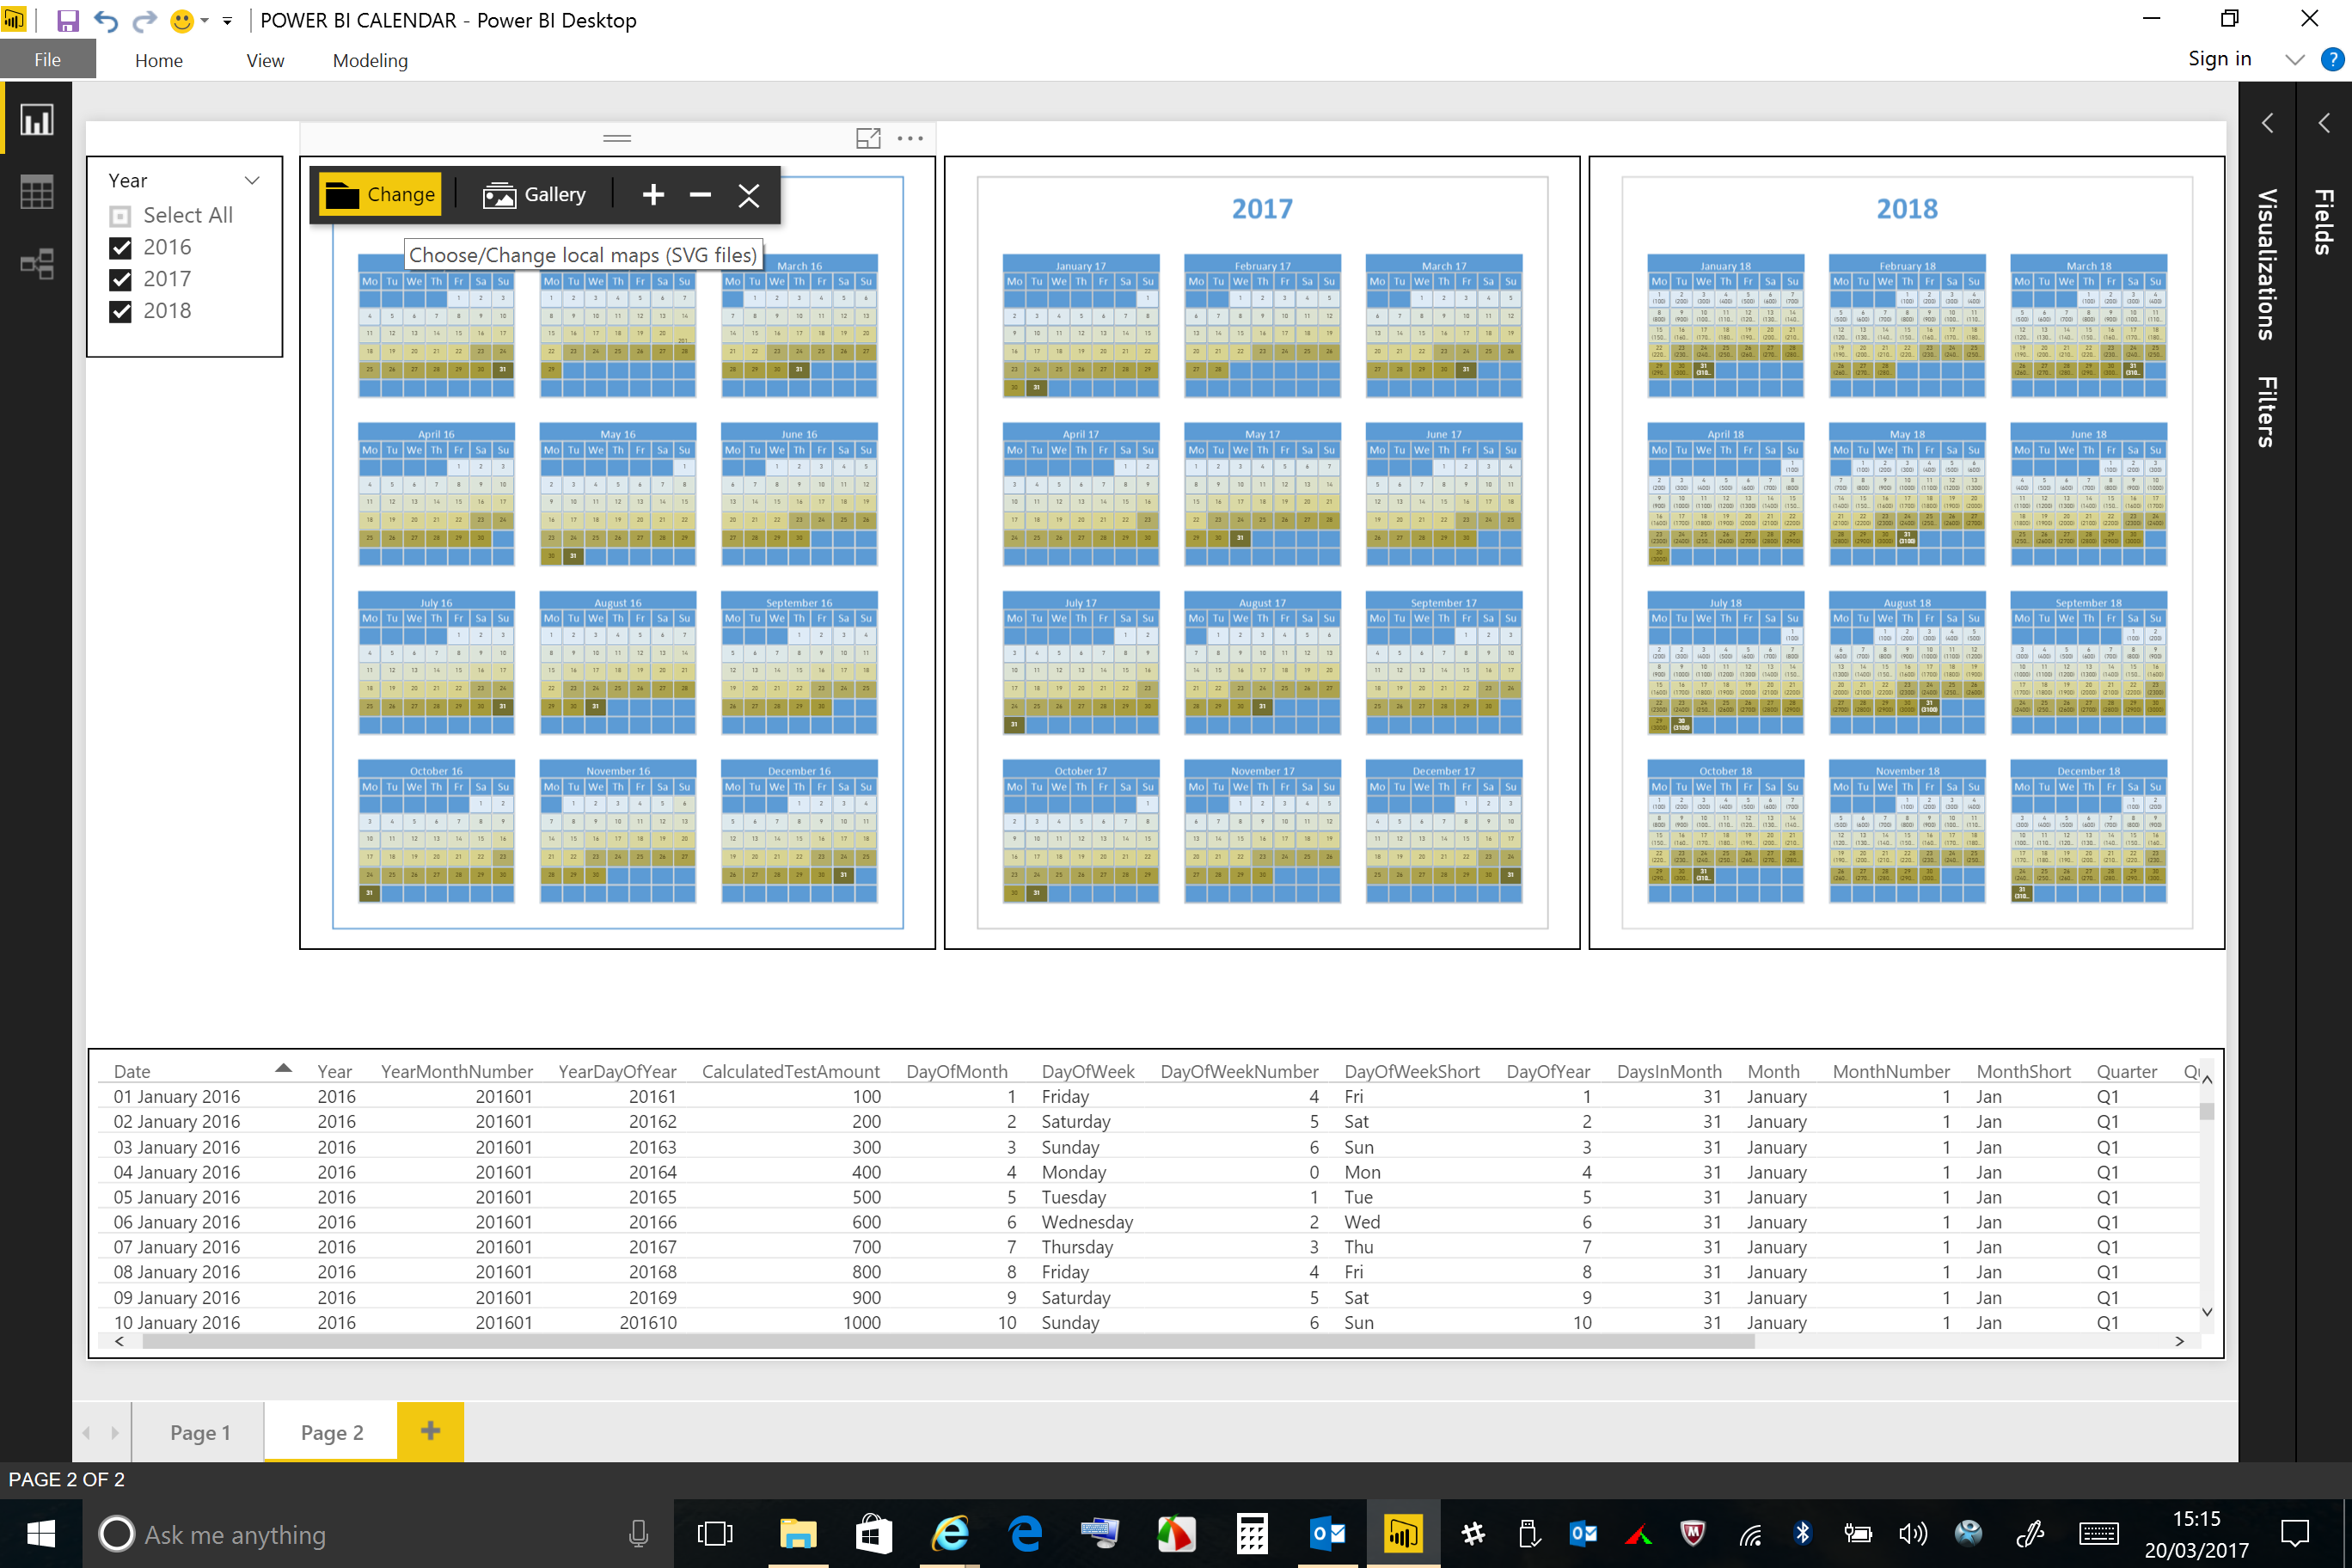
Image 1: Report showing Calendars for the years 2016, 2017 and 2018 with the associated source data table below (in this case a Calendar Table with a column containing a test amount for display purposes). The calendars are SVG files that are added to the report using the “Synoptic Panel by OKViz” custom visual.
Click HERE to open up the interactive report in a new tab.
Click HERE to open up, in a new tab, a new version of the interactive report which demonstrates the ability to easily create calendars in other languages.
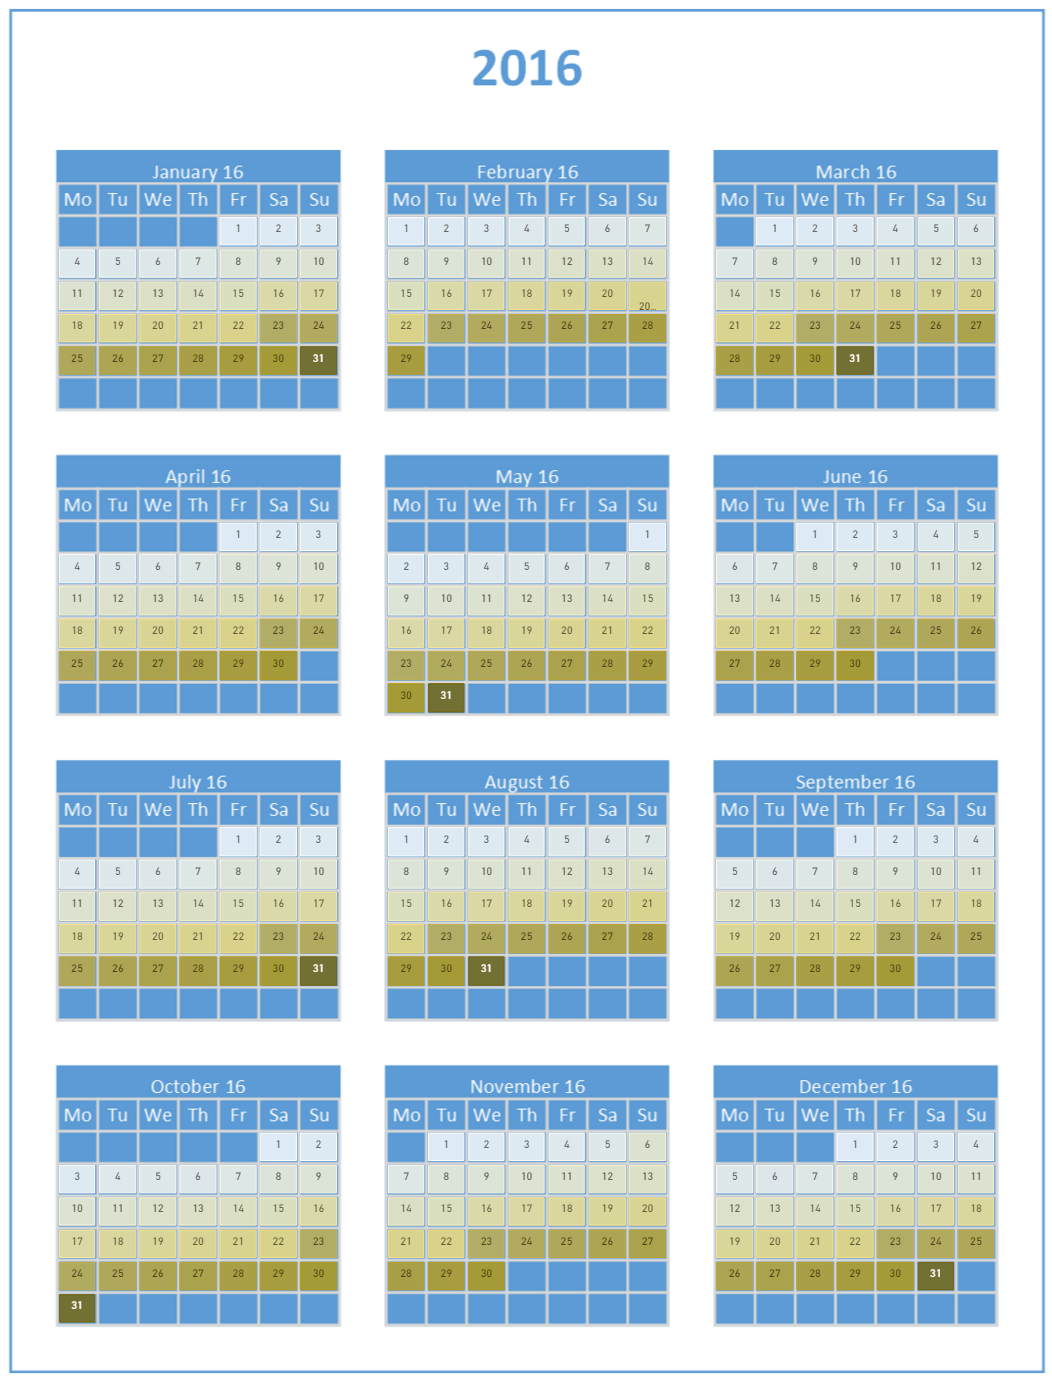 Image 2: Calendar for 2016 (in focus mode) showing the day of the month with fill colours dependant on the range of values defined in the 5 States that are available in the “Synoptic Panel by OKViz” custom visual.
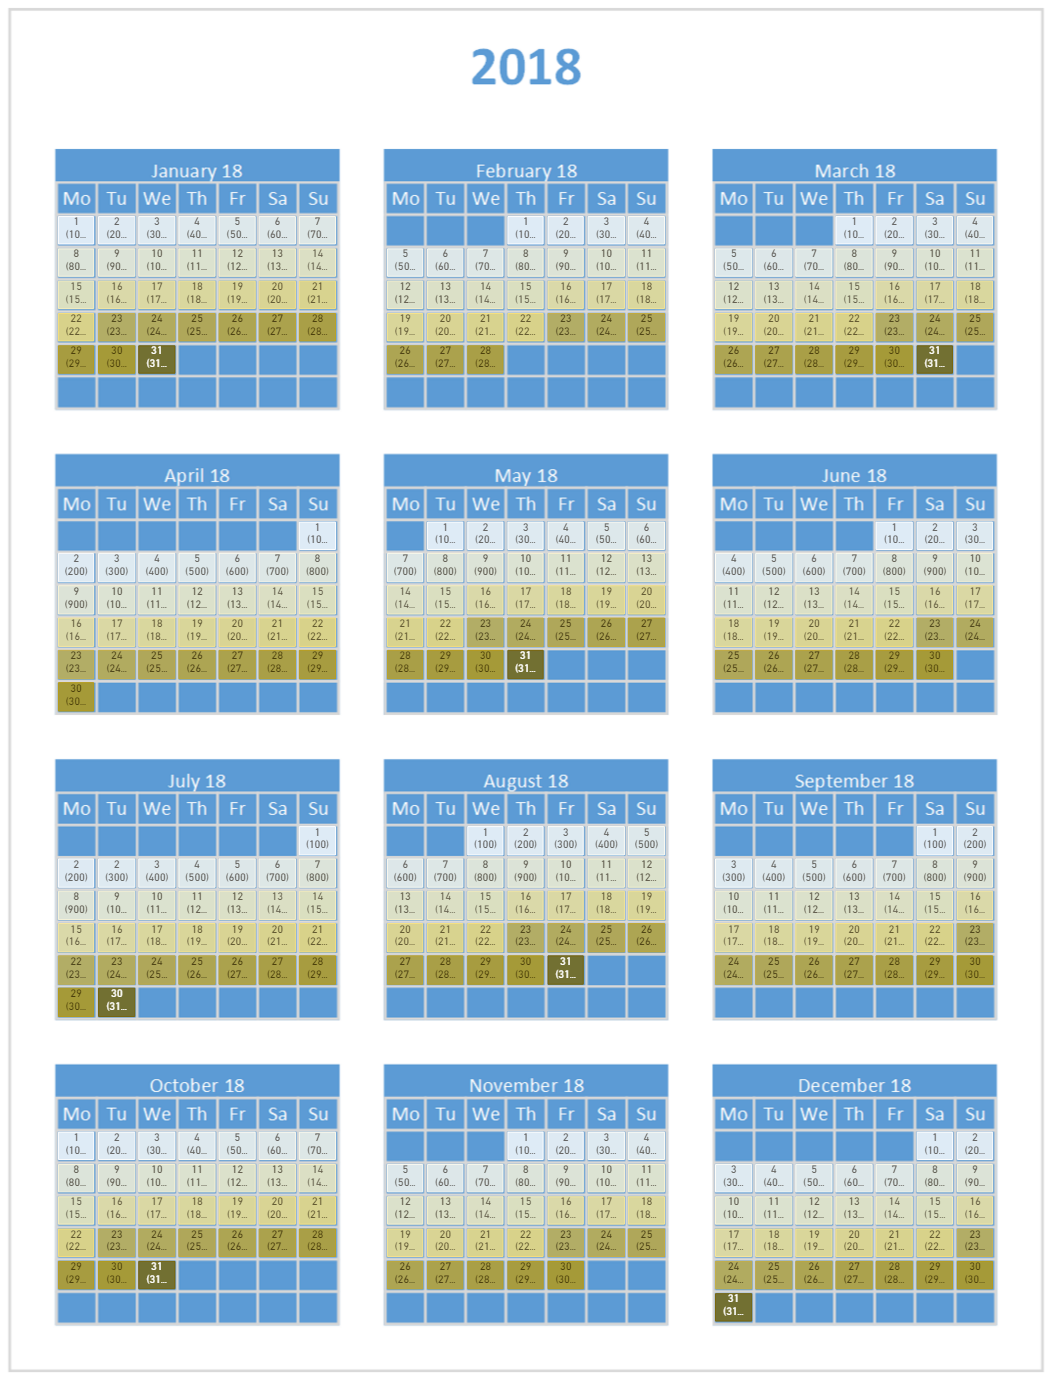 Image 3: Calendar for 2018 (in focus mode) showing the day of the month and data value with fill colours dependant on the range of values defined in the 5 States that are available in the “Synoptic Panel by OKViz” custom visual.
INTERESTED?
If you are interested in having copies of the Calendars (other language versions will be considered – depends on how much free time I have) then send me an email at fred.williams@insightfuldatasolutions.com
I might also add them later to the Gallery at http://synoptic.design/ (need to investigate whether that would be possible).
Following is a brief description of the steps that I took to create the Calendars (for those of you who are interested)
Step 1:
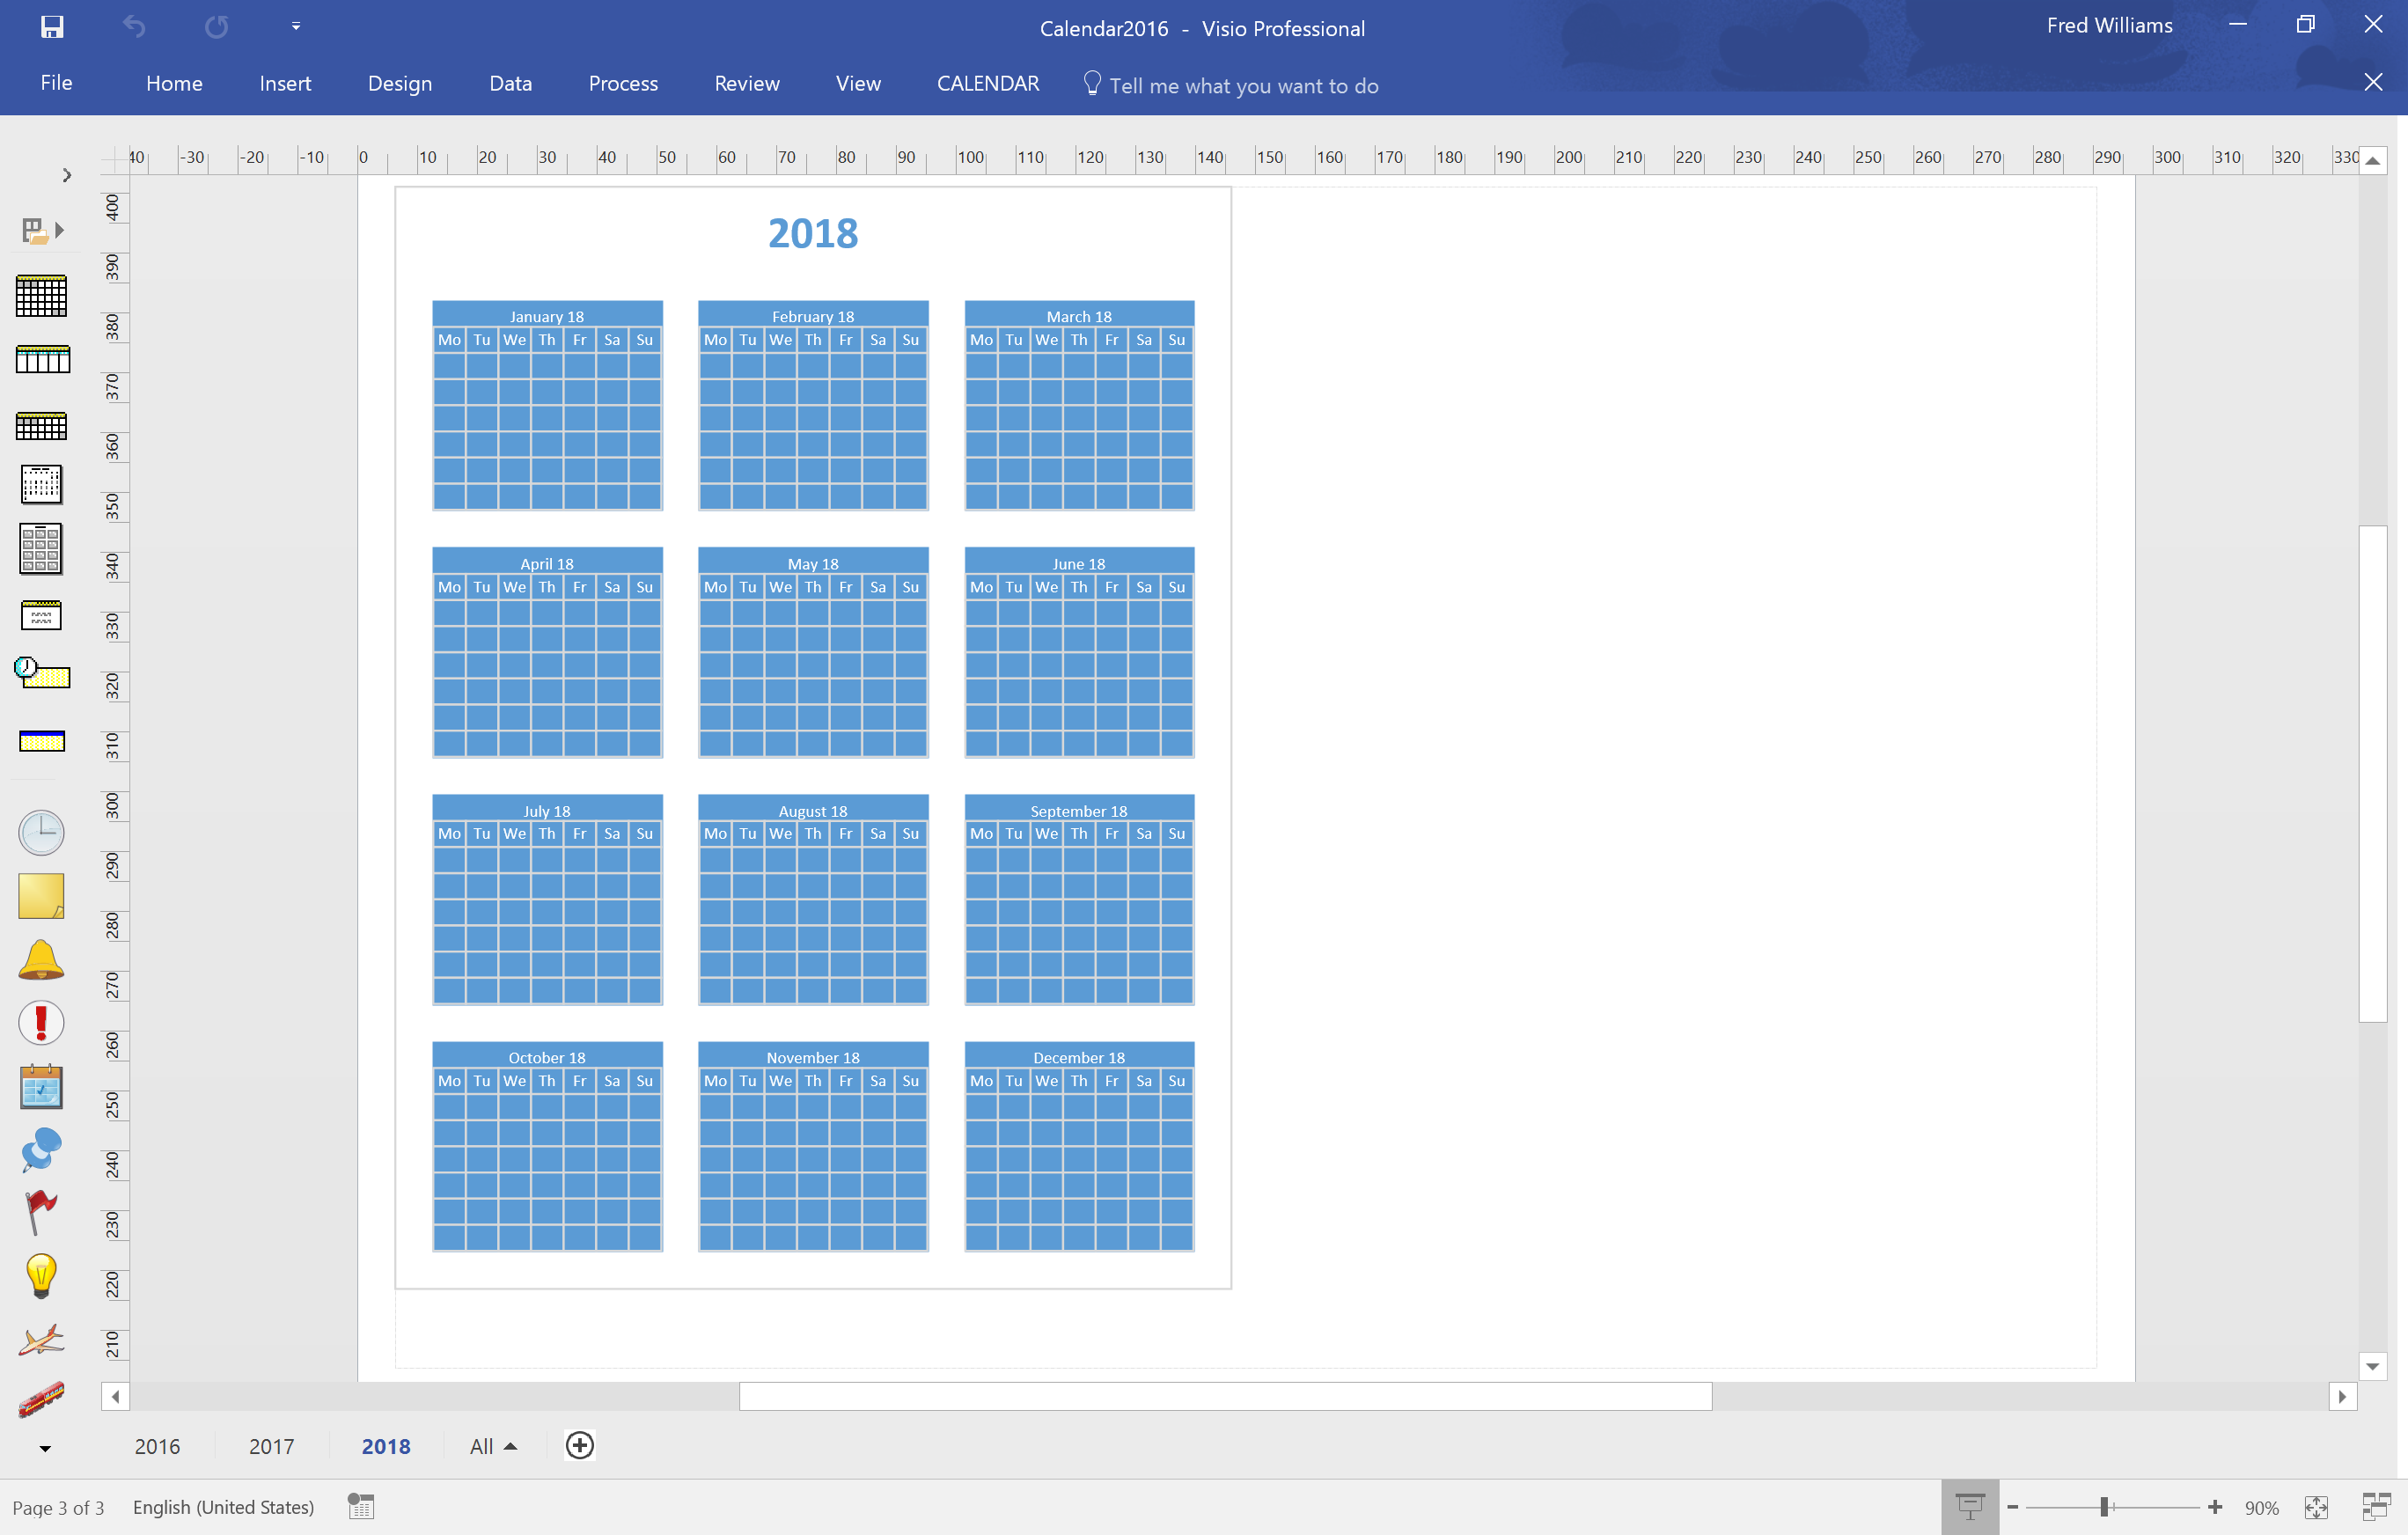
Create a calendar in the desired language using Microsoft Visio and export as a png file.
Step 2:
Upload the png file exported from Microsoft Visio to the website http://synoptic.design/
Now spend a not short period of time creating index names for all the days in the year (365/366)! it is recommended that the index names have the format YYYYnn as this can be automatically created when creating a Calendar table (which is to be linked to the source data using the date field). The second box (Area Name for display) needs to be updated with the number of the day within the month for display in the final calendar.
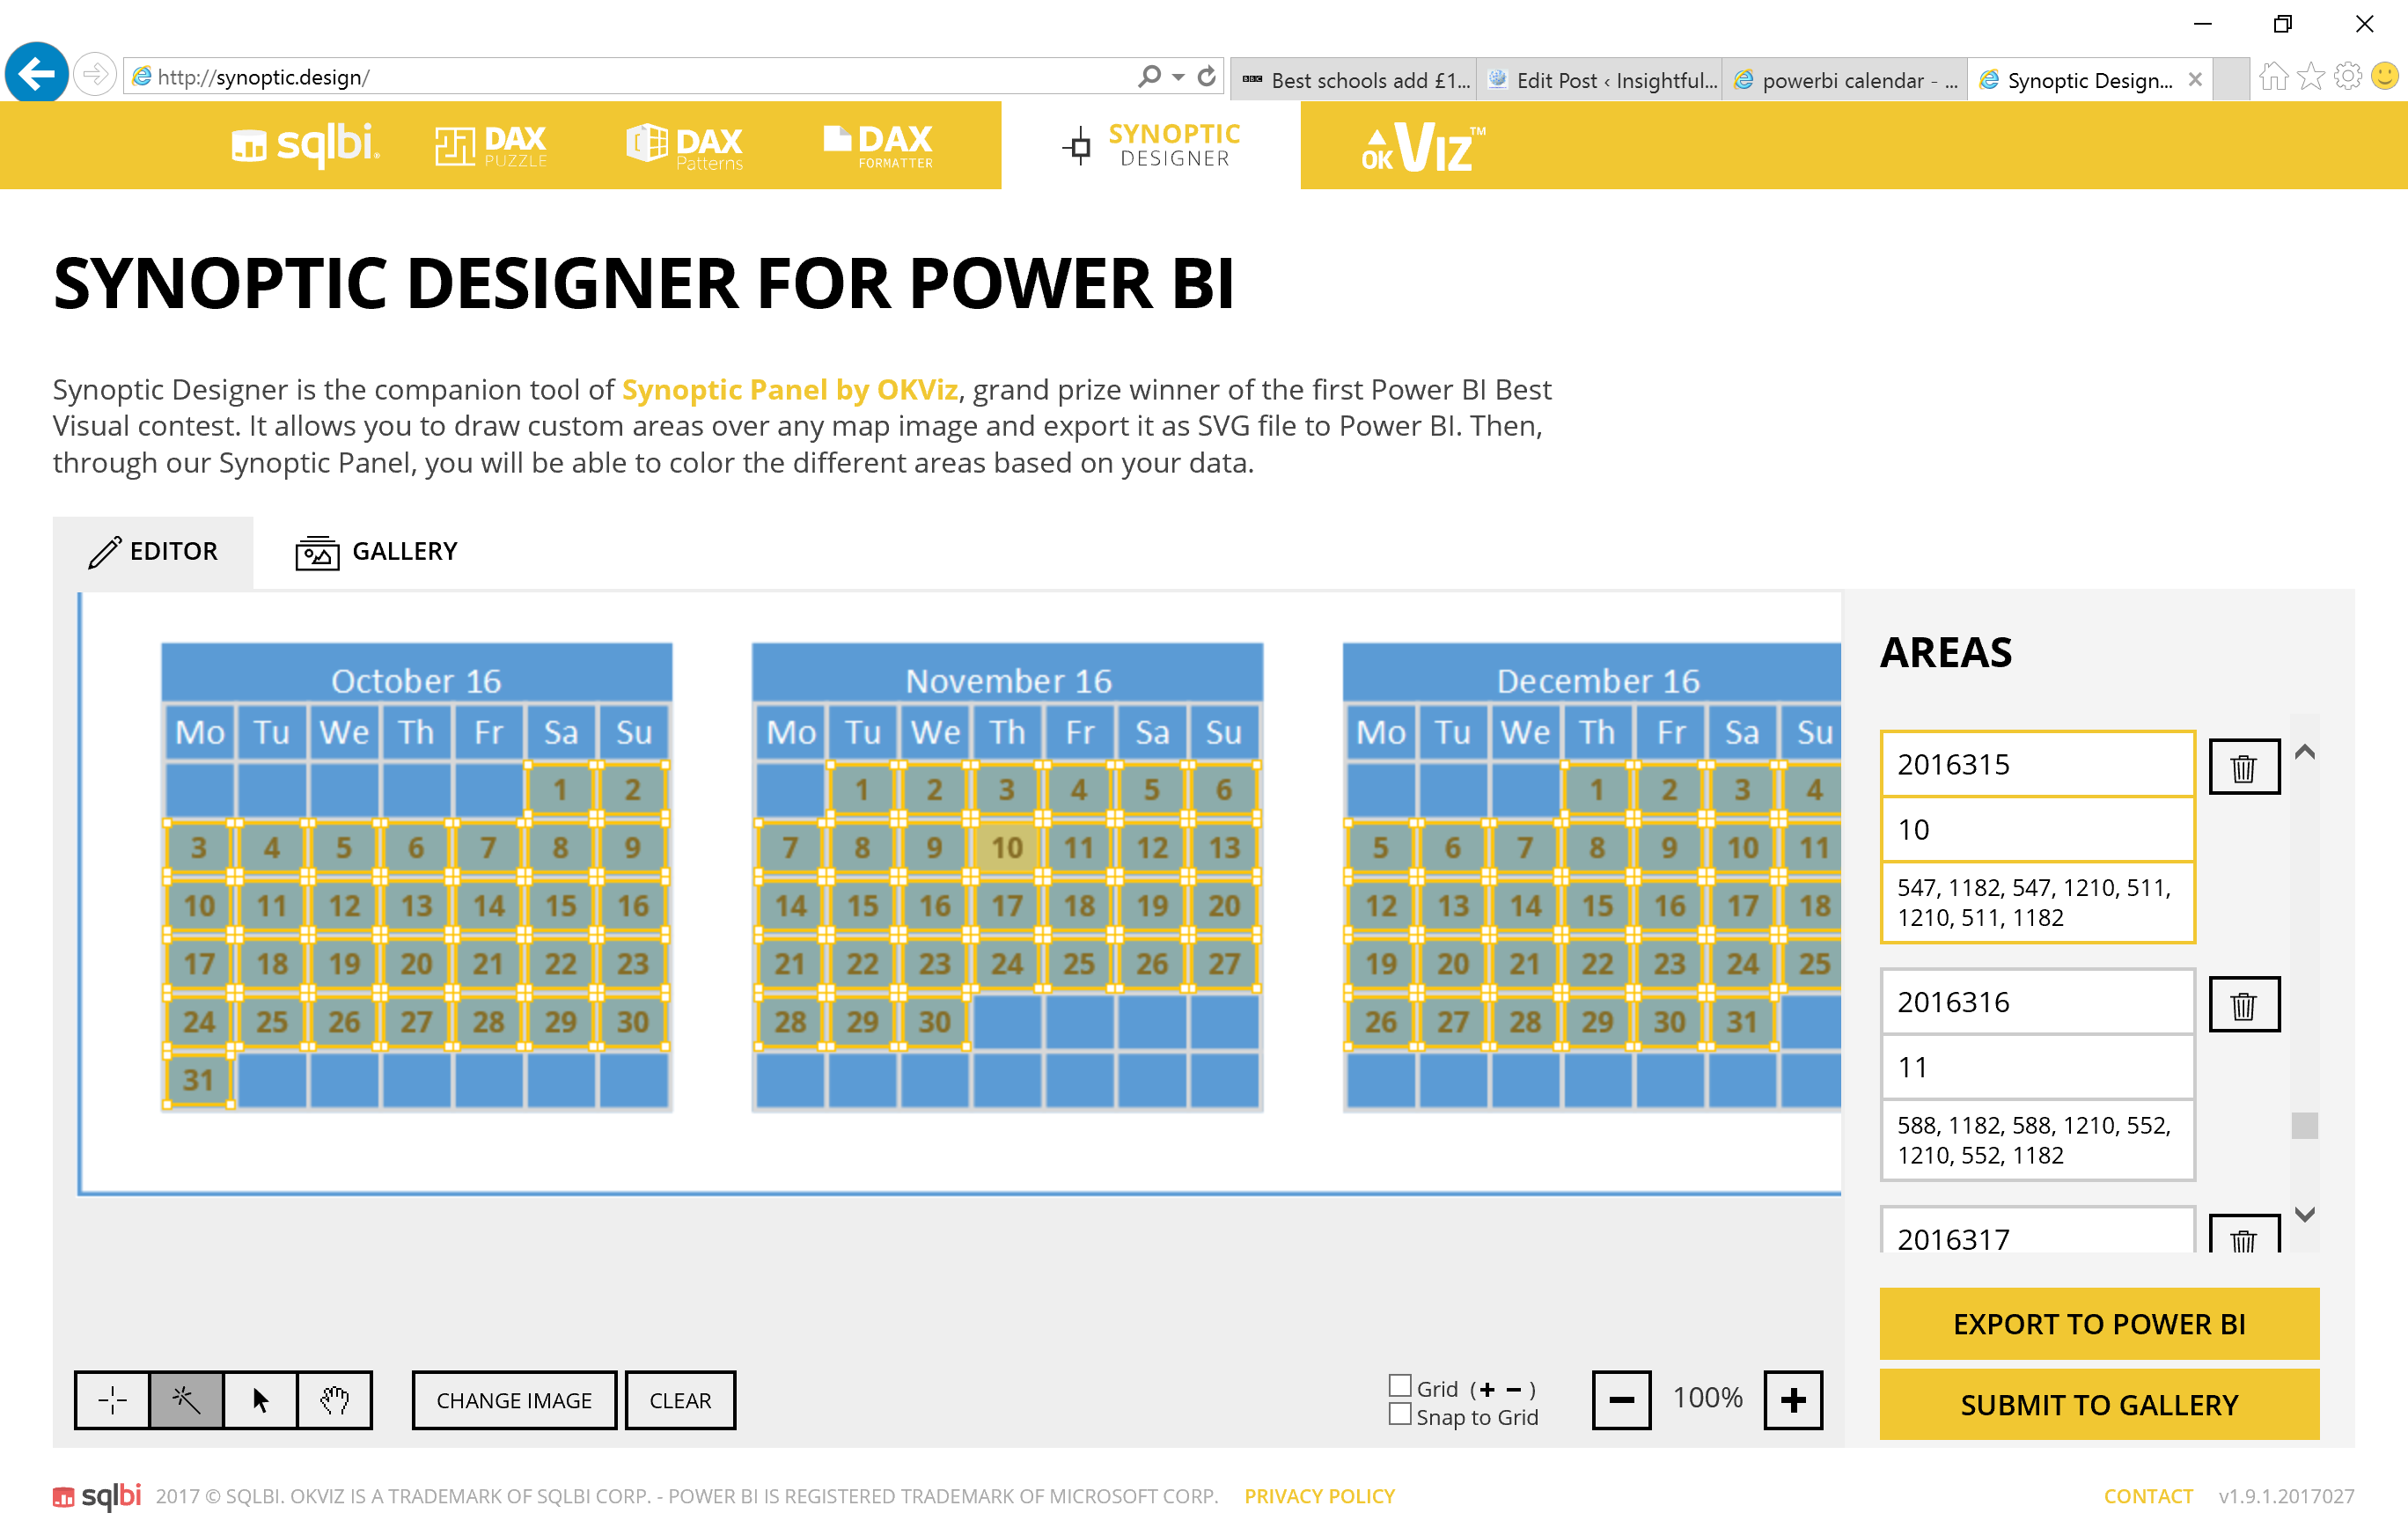
When this task has been completed click on the “EXPORT TO POWER BI” button to save the SVG file on your PC.
Step 3:
Add the “YearDayOfYear” column to the Category field, the “Calculated Test Amount” column to the Measure field and any fields that you want to the Tooltips field.
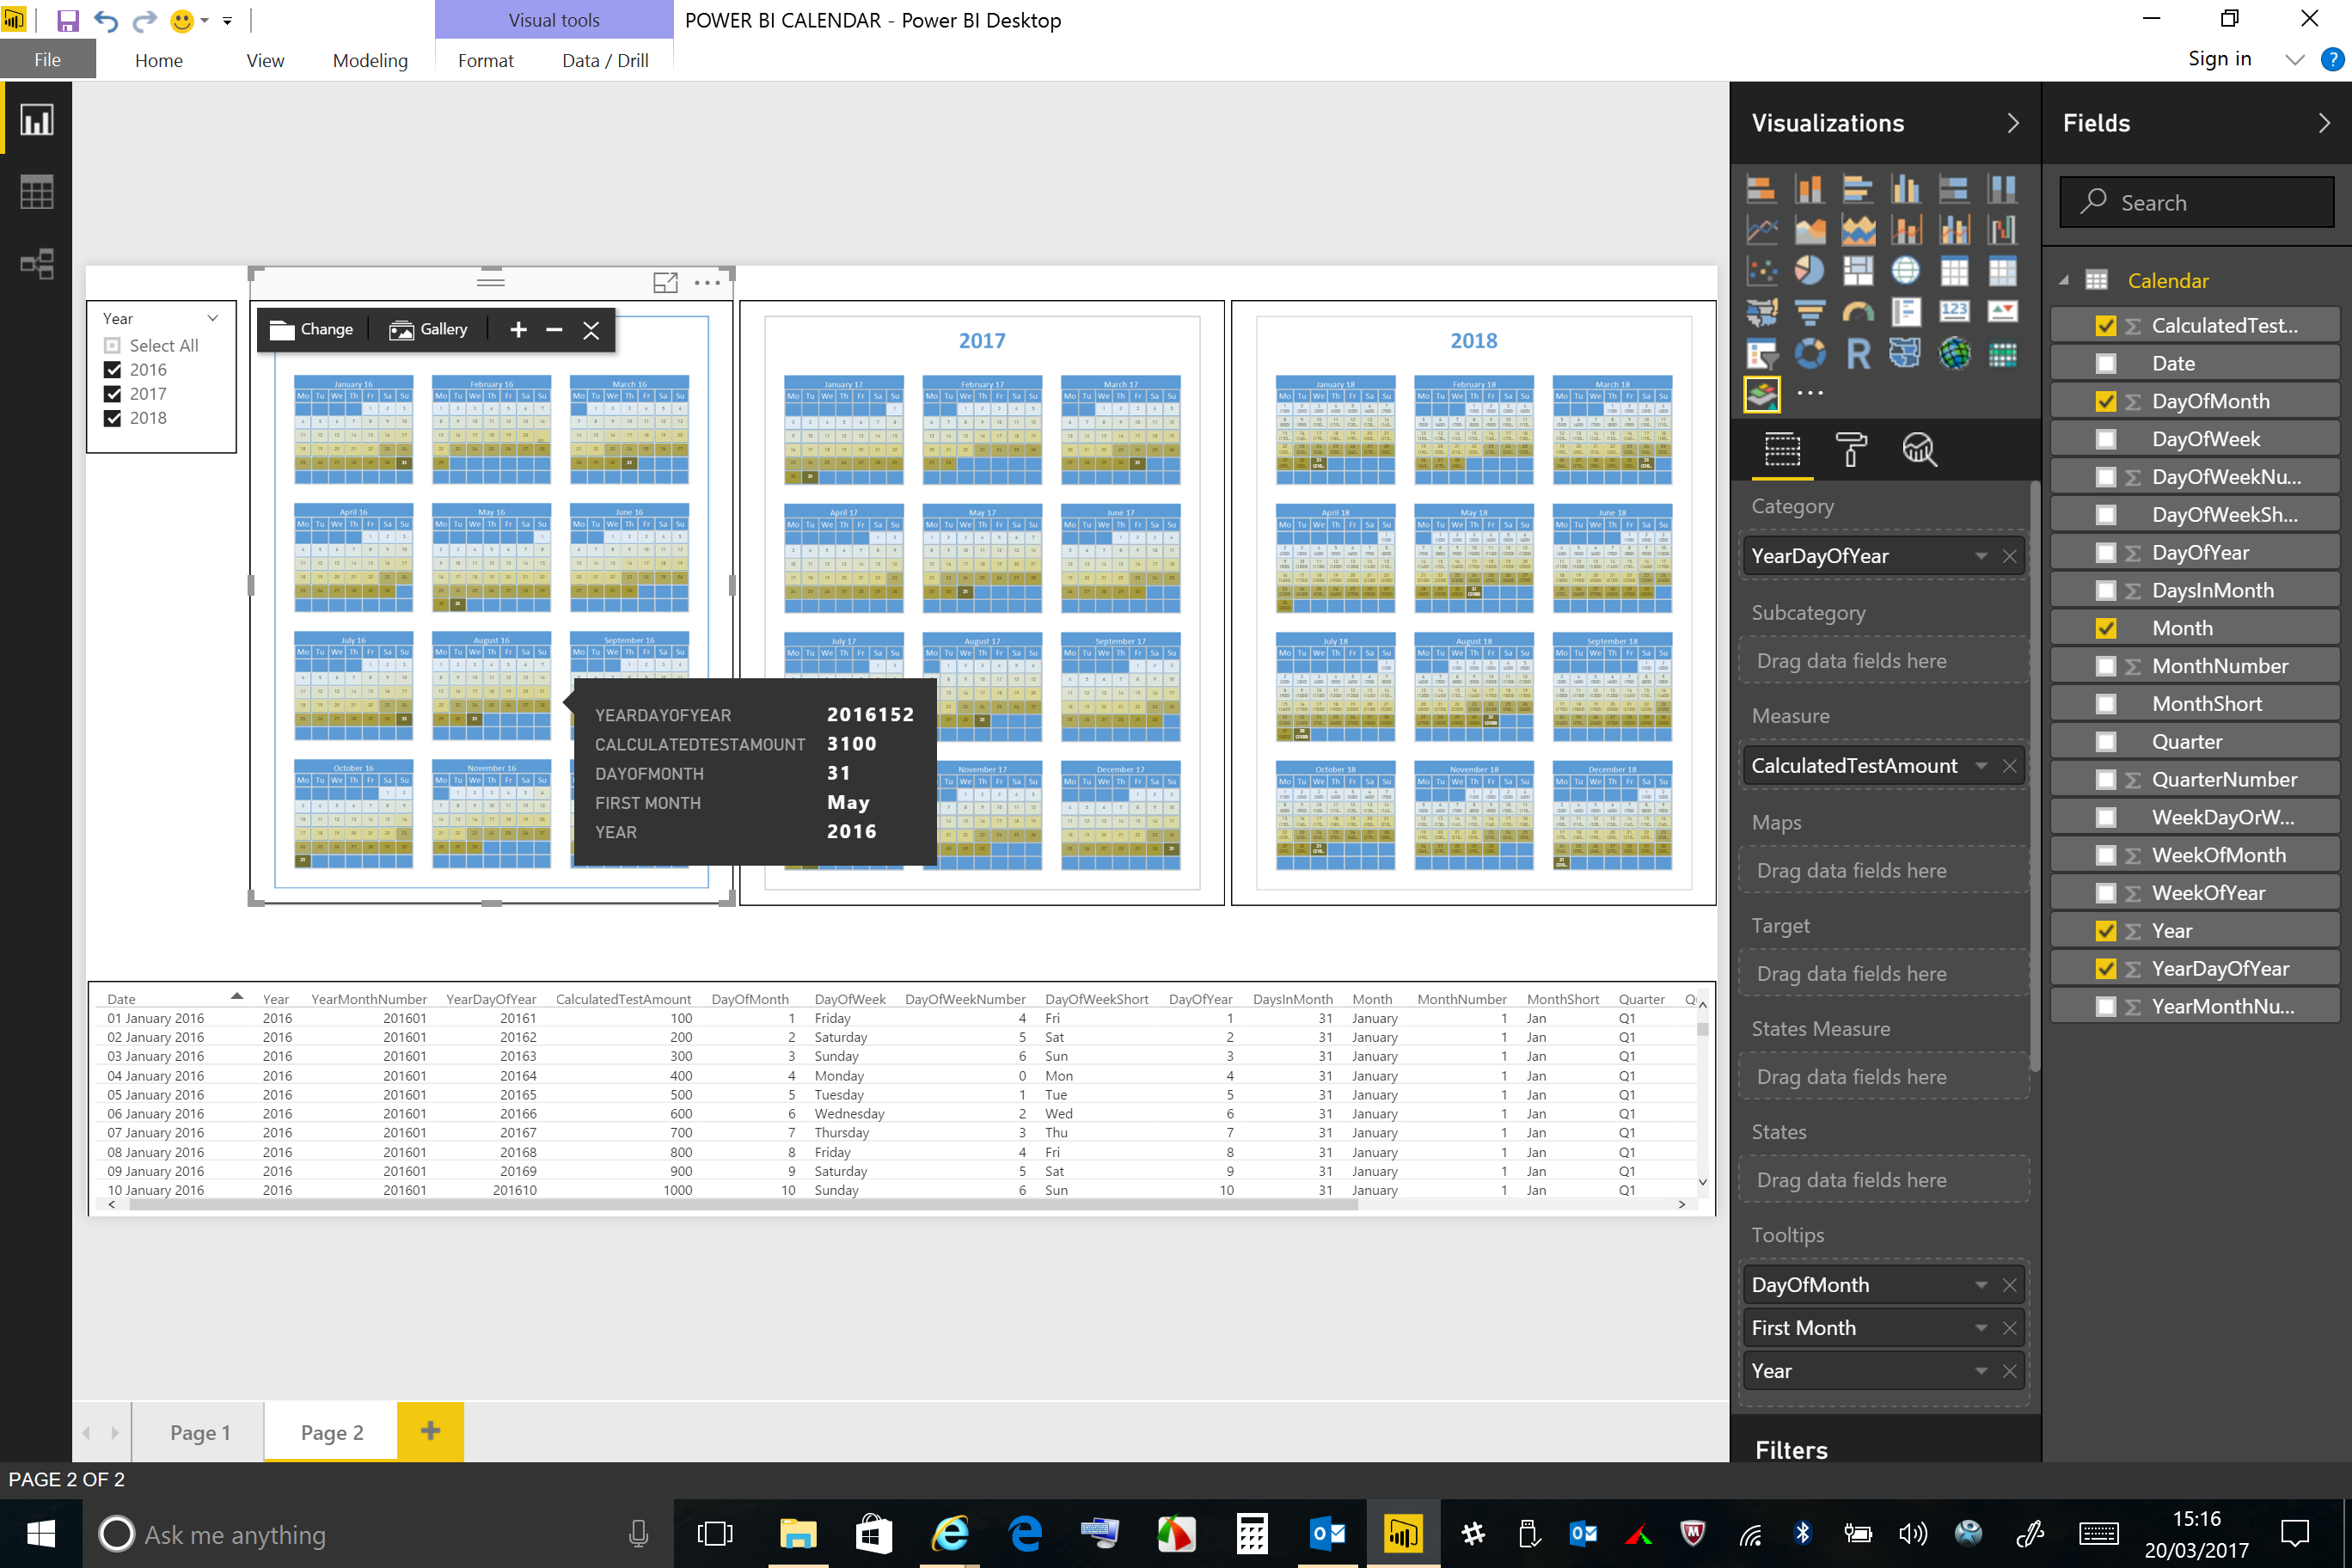
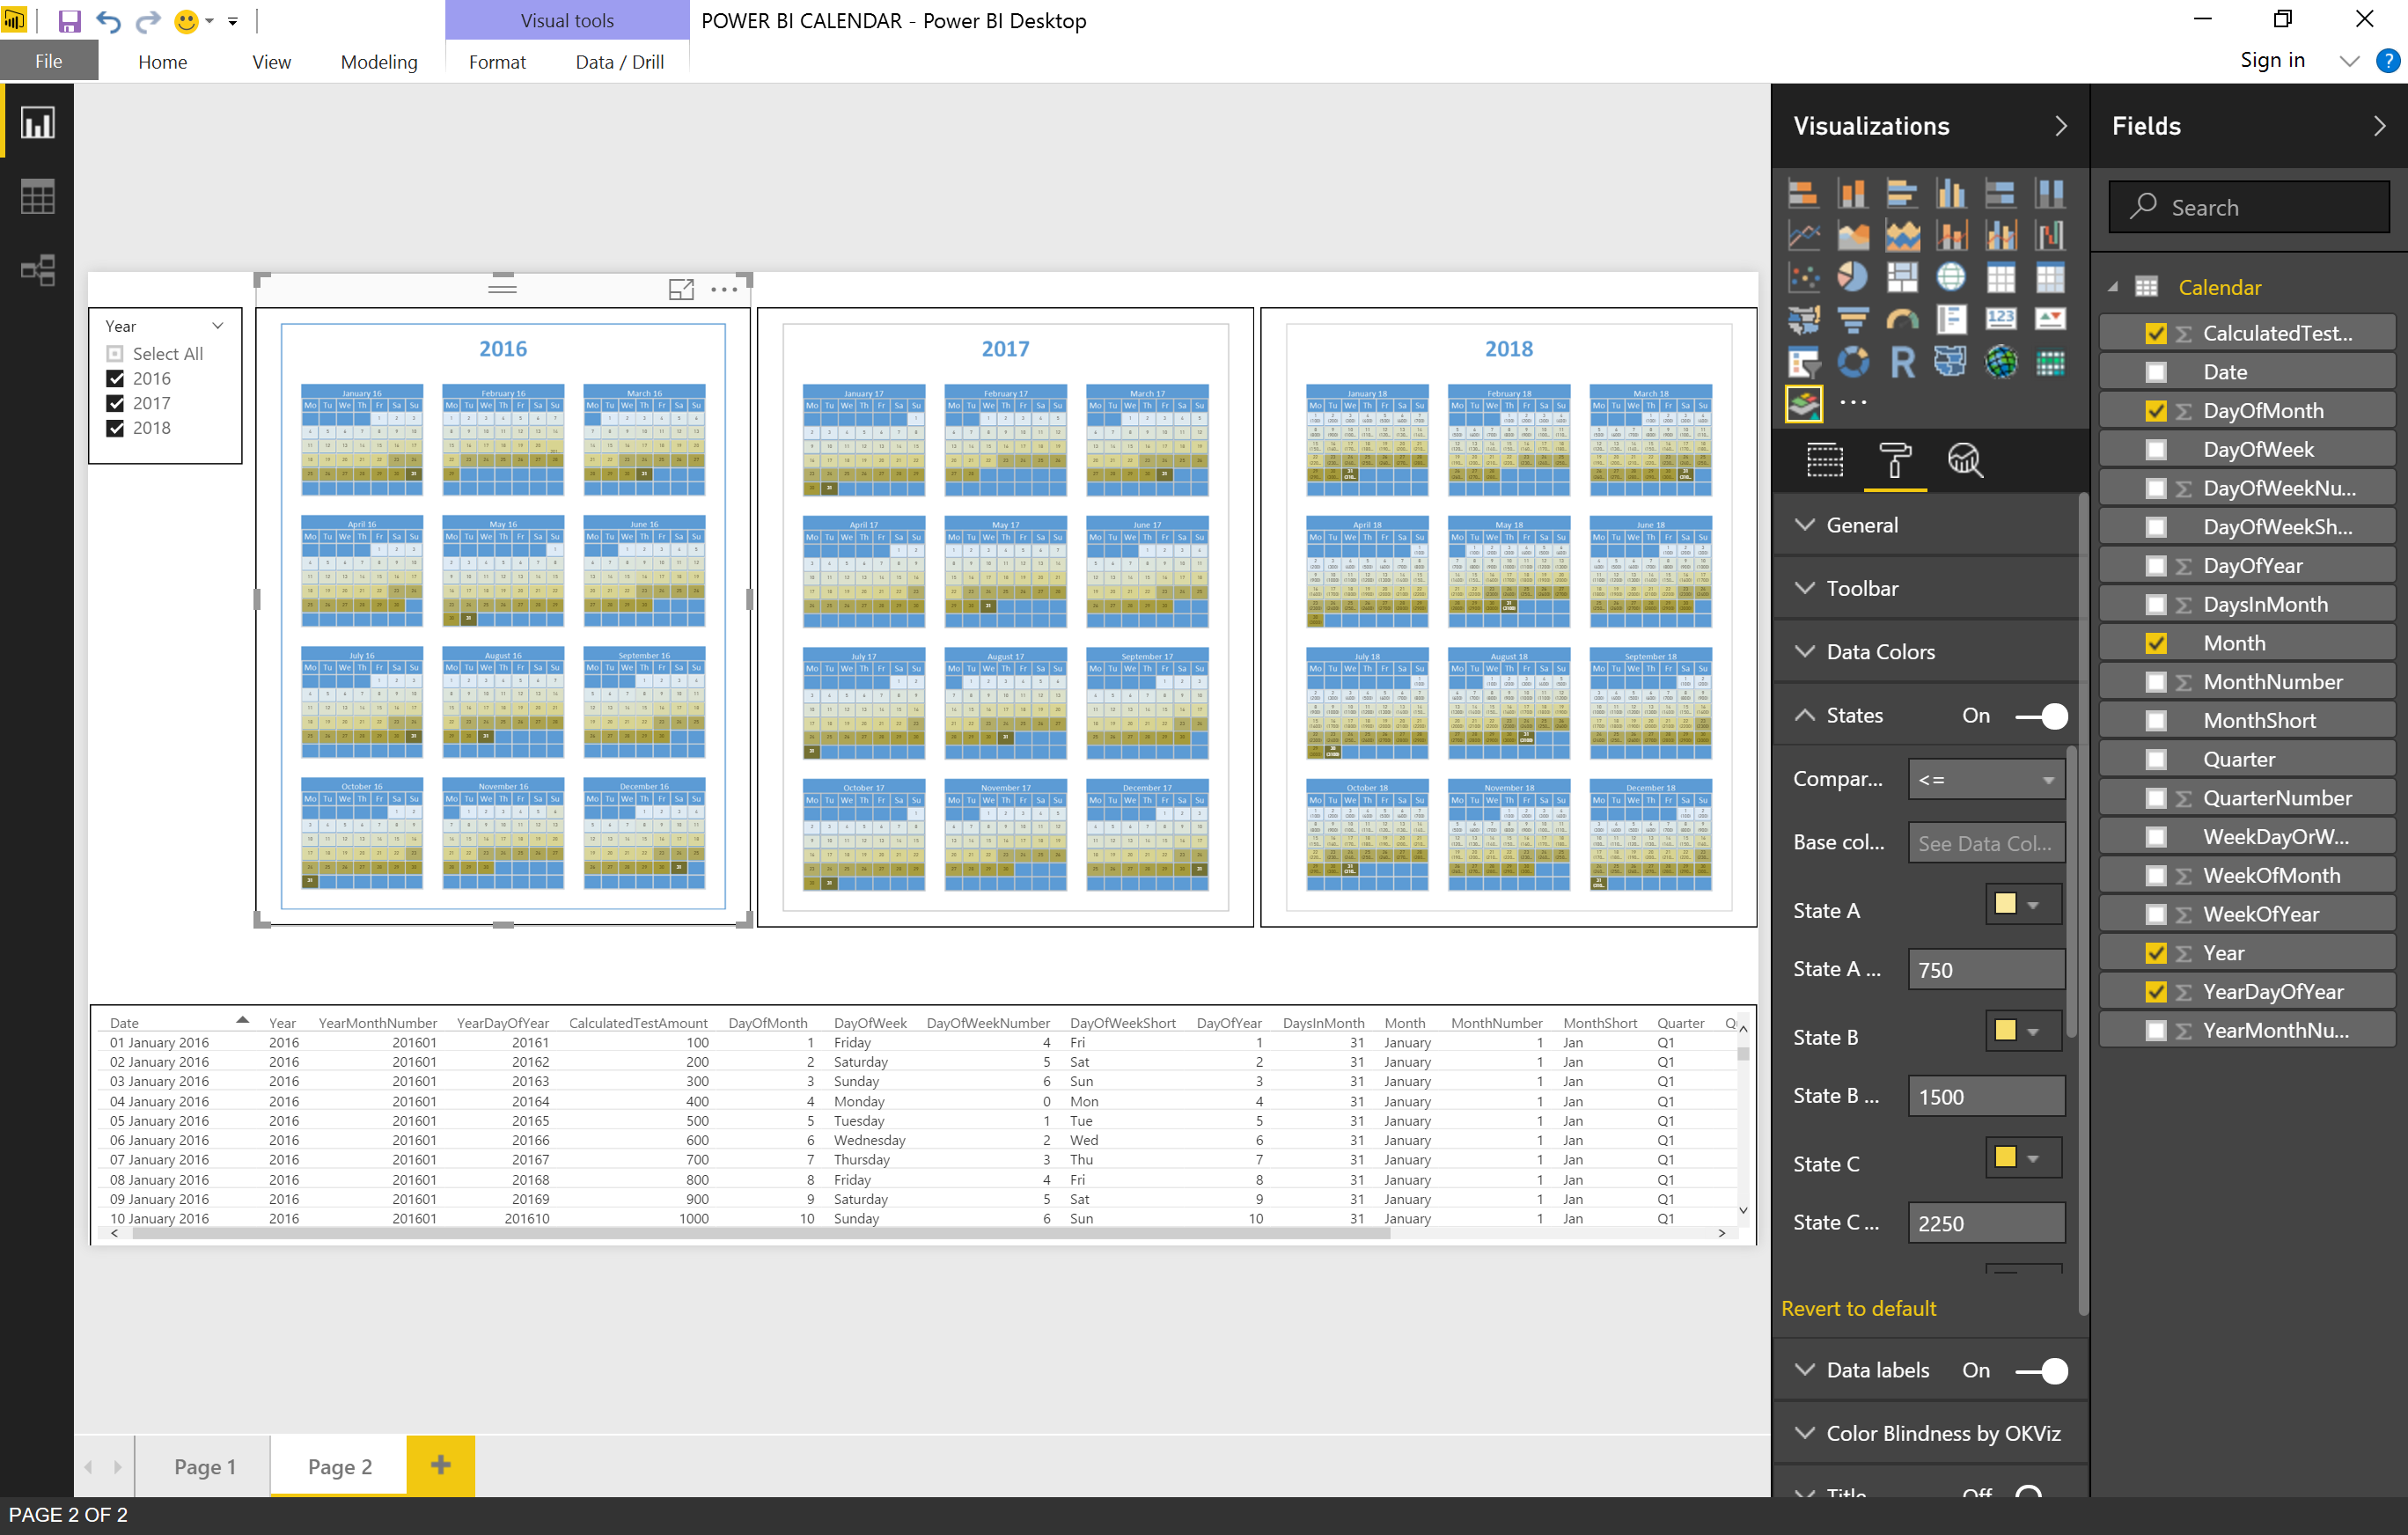
Add the required ranges to the State fields.
….. and here is the final report:
Here’s hoping that this was of interest. If you have any questions feel free to contact me at fred.williams@insightfuldatasolutions.com

