ABC Automotive (Europe) Ltd. – European Sales Network Reports
My original Microsoft Access “demo” database, described here, now contains 1,050,000 fictitious car Sales and Finance agreements, distributed throughout Europe (EU & EFTA) and is representative of the current actual ratio of registrations in this region.
Click HERE to view the interactive reports in a new browser tab.
I have then created, using this database, a number of sample reports using Microsoft Power BI for a fictitious company, ABC Automotive (Europe) Ltd.
The primary focus of these reports is to demonstrate how a European Sales Network can be fully integrated into the business reporting for a company providing business insights that are based on geographic areas.
The European Sales Network created for ABC Automotive (Europe) Ltd. is based on the NUTS classification (Nomenclature of territorial units for statistics), a hierarchical system for dividing up the economic territory of the EU for the purpose of the collection, development and harmonisation of European regional statistics and Socio-economic analyses of the regions (most EU data is referenced to this classification thus providing links to this extensive data for your all of your own internal data).
The areas assigned to the fictitious Dealers in the European Sales Network for ABC Automotive (Europe) Ltd. are based on the NUTS CODE 2 (Province) areas which are an accumulation of the lowest level NUTS CODE 3 (District) areas. It is, of course, possible to use any other geographic boundaries to create the network.
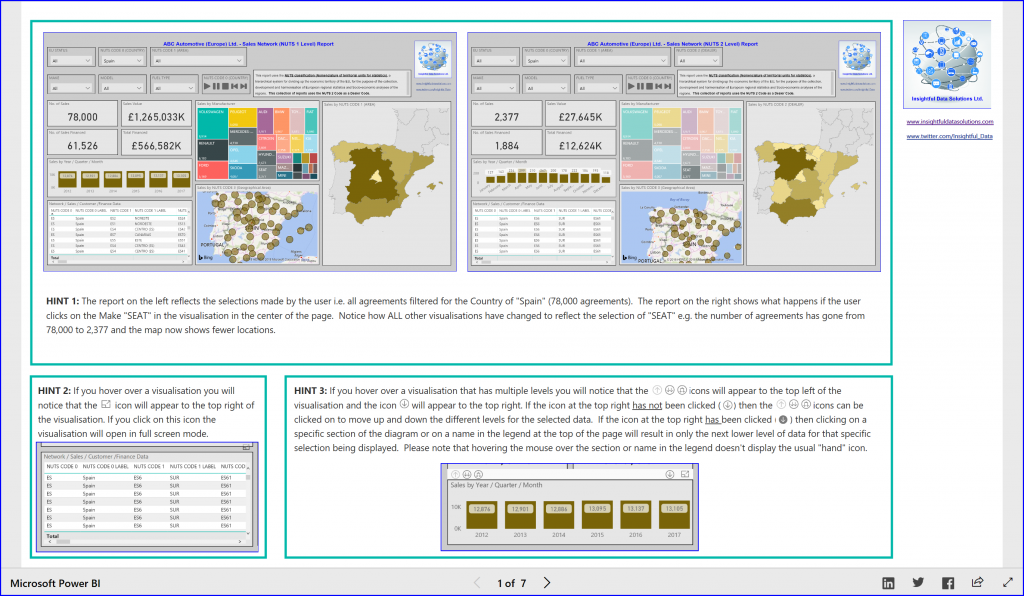
Image 1: Three hints on how to select the display of information within the visualisations i.e. in addition to using the filters/slicers at the top of the page.
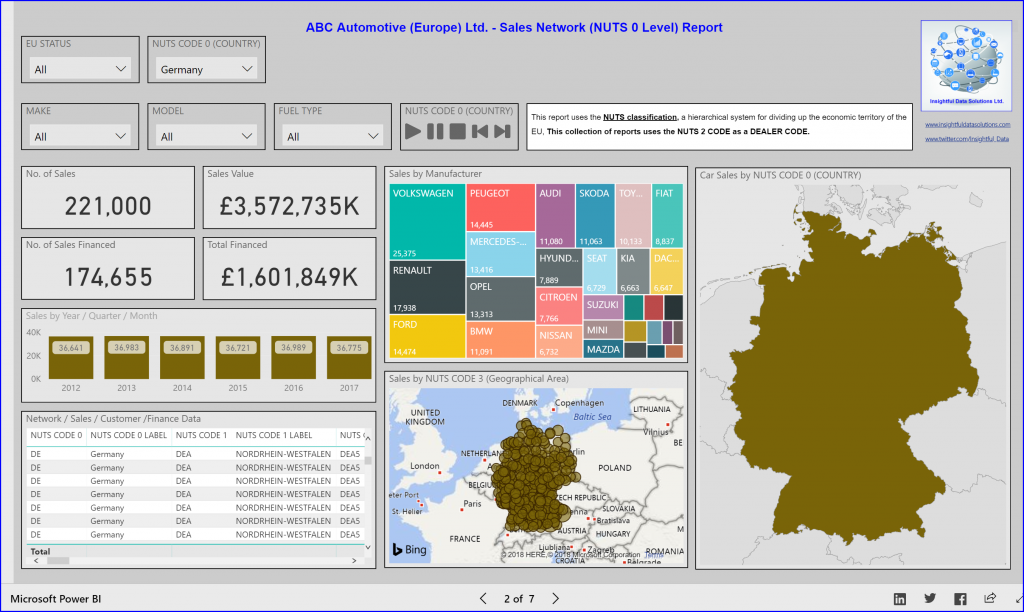
Image 2: A report containing a number of different visualisations of data at the Country level (NUTS CODE 0).
The “Asset Make Player” box when activated will automatically play through the report results for each individual Country, like a slide-show, with the ability to play continuously, pause or stop the player.
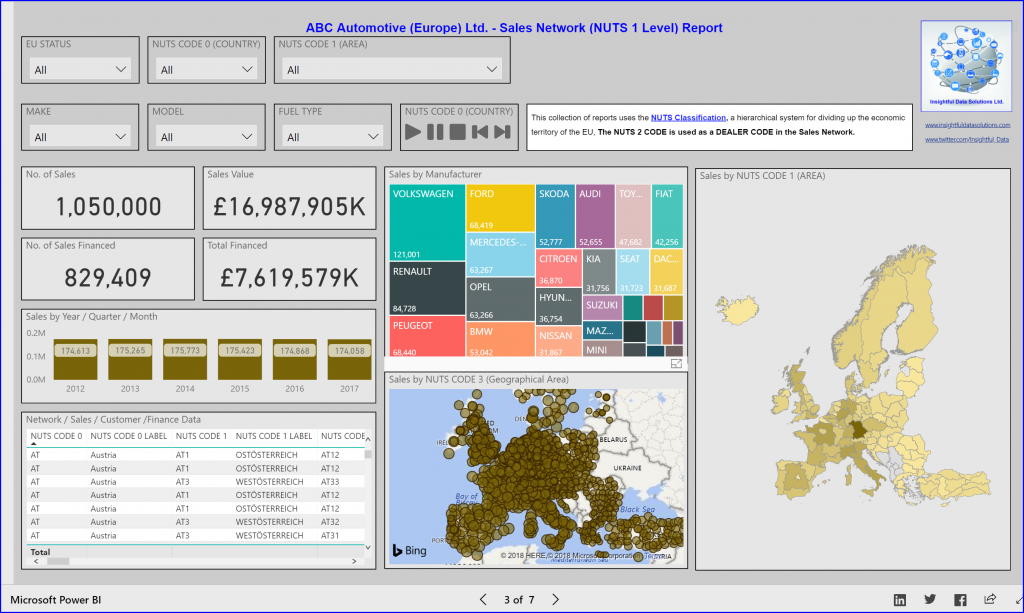
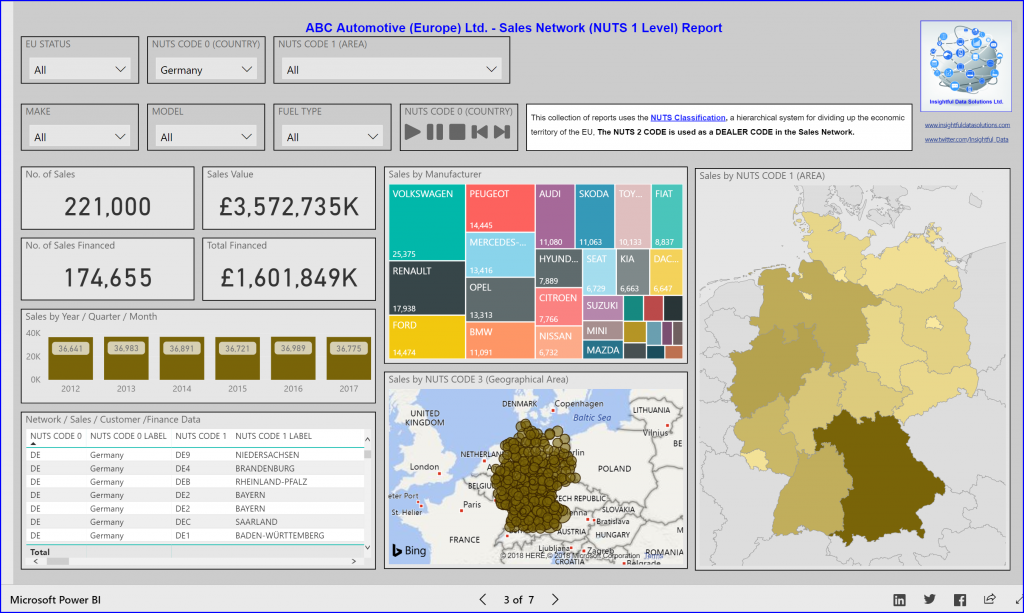
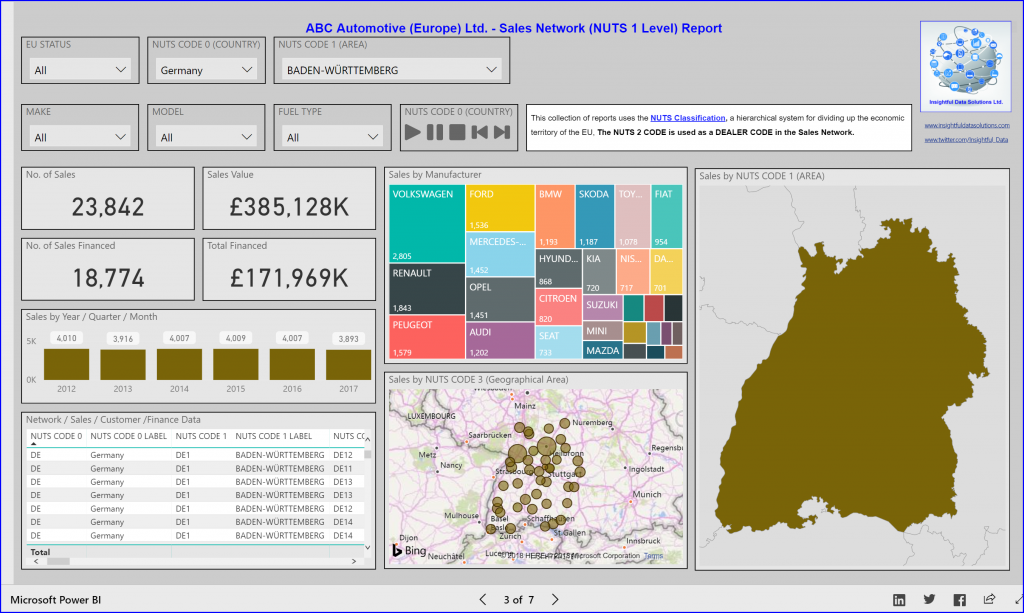
Images 3a, 3b, 3c: The above images demonstrate how the drop-down selection menus enable the user to drill down from all countries in Europe to the “Baden-Wuertemberg” area of Germany. The report contains a number of different visualisations of data at the NUTS CODE 1 level (Region).
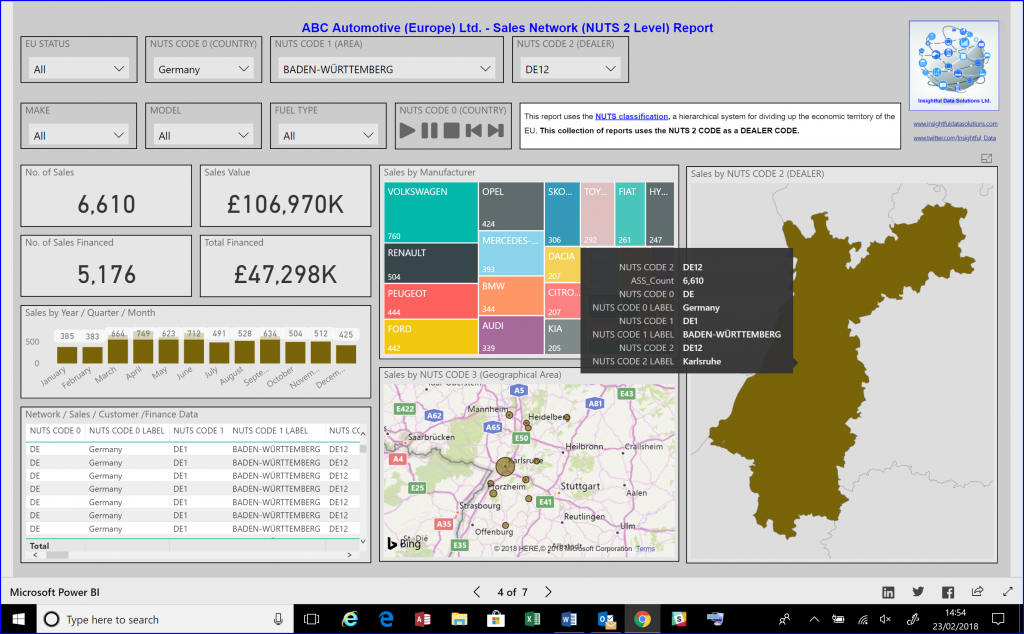
Image 4: A report containing a number of different visualisations of data at the NUTS CODE 2 (Province) level. This level is used to represent the area assigned to a Dealer in the various reports.
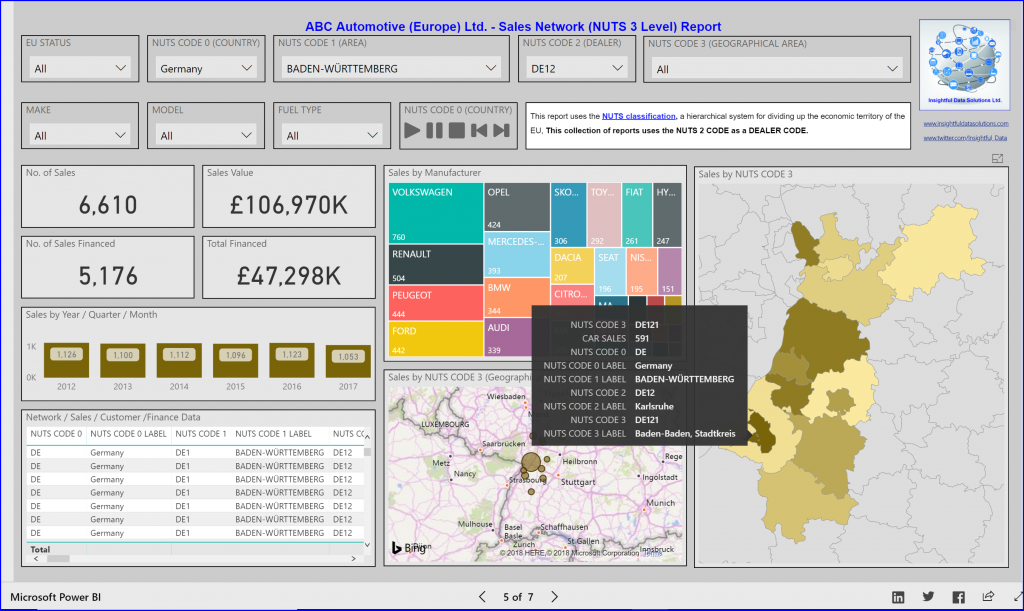
Image 5: A report containing a number of different visualisations of data at the NUTS CODE 3 level (District). The areas on this level are accumulated to form the area assigned to the Automotive Dealer in the various reports.
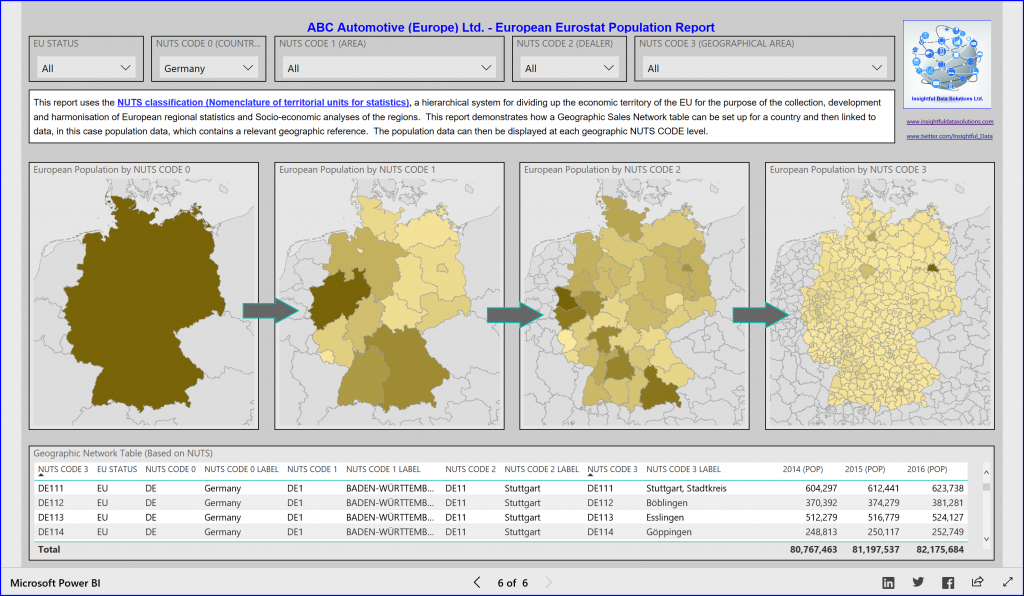
Image 6: This report shows how the different NUTS areas of Germany can be shown in reports, at different levels of detail, and how it is possible to link the areas directly to any data that contains the relevant geographic reference, in the case of these reports, the references are the NUTS CODES.
Here’s hoping that this was of interest. If you have any questions feel free to contact me at fred.williams@insightfuldatasolutions.com