ABC Automotive (UK) Ltd. – Financial Services Reports
Using the Microsoft Access “demo” database, described here, I have created Microsoft Power BI reports for various areas of the Financial Services Division of a fictitious company, ABC Automotive (UK) Ltd.
Click HERE to view the interactive reports in a new browser tab.
The database, together with other data, were imported into Microsoft Power BI and, where necessary, were transformed using the ETL, or transformation, functions that are embedded in the desktop / online software (Power Query / “M” language / “DAX” language ).
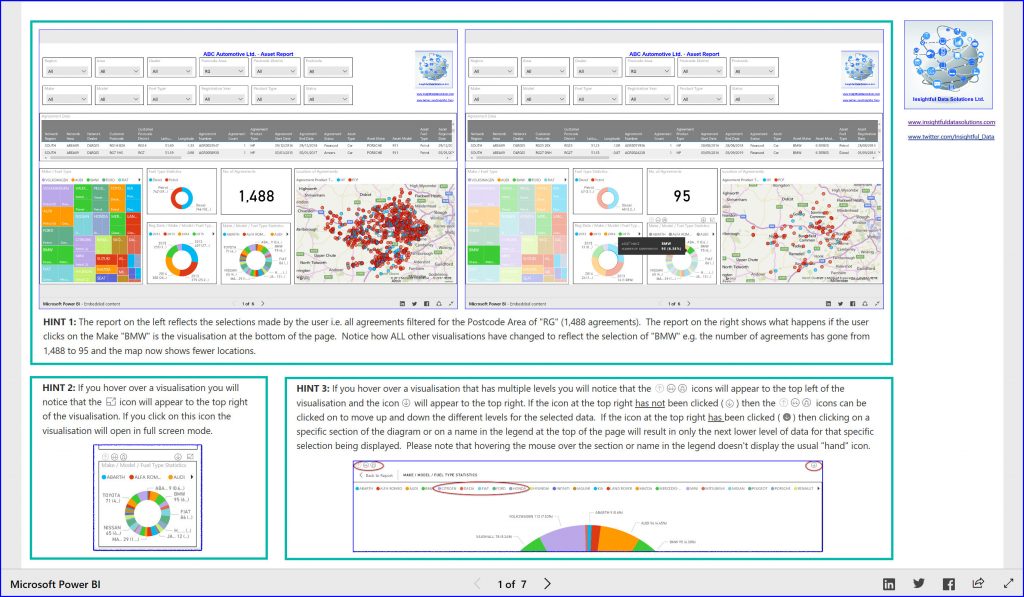
Image 1: Three hints on how to select the display of information within the visualisations i.e. in addition to using the filters/slicers at the top of the page.
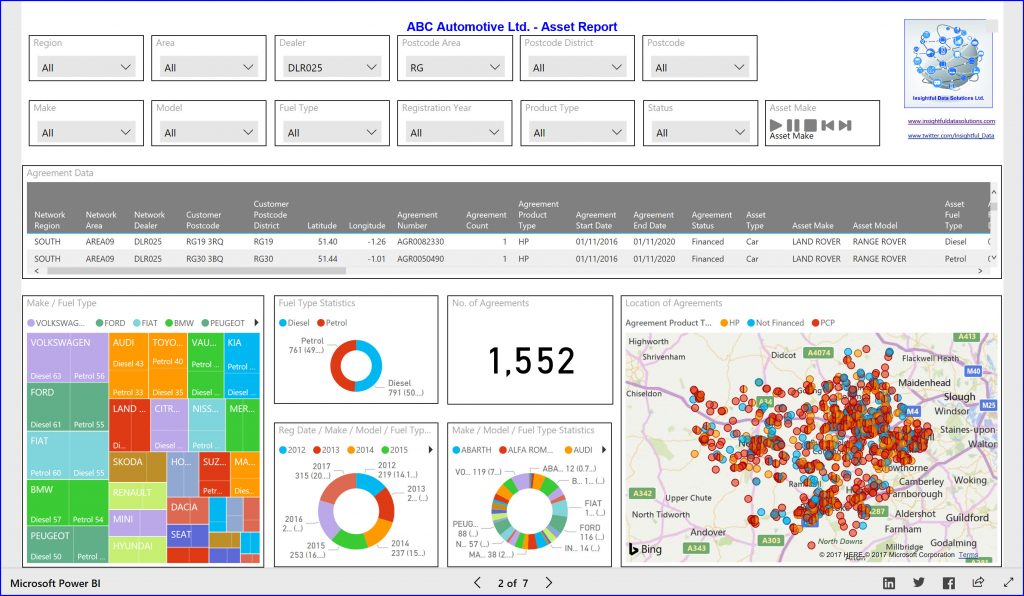
Image 2: Asset report containing a number of different visualisations of data related to the asset that may or may not be financed. It is possible, in this report, as well as in the others, to filter all data using Geographical, Asset and Finance criteria.
The pie and donut charts offer the ability to drill down through the data e.g. from Make to Model to Fuel Type. The matrix visualisation is an interesting way of visualising the selected data.
The “Asset Make Player” box when activated will automatically play through the report results for each individual Asset Make, like a slide-show, with the ability to play continuously and pause or stop the player.
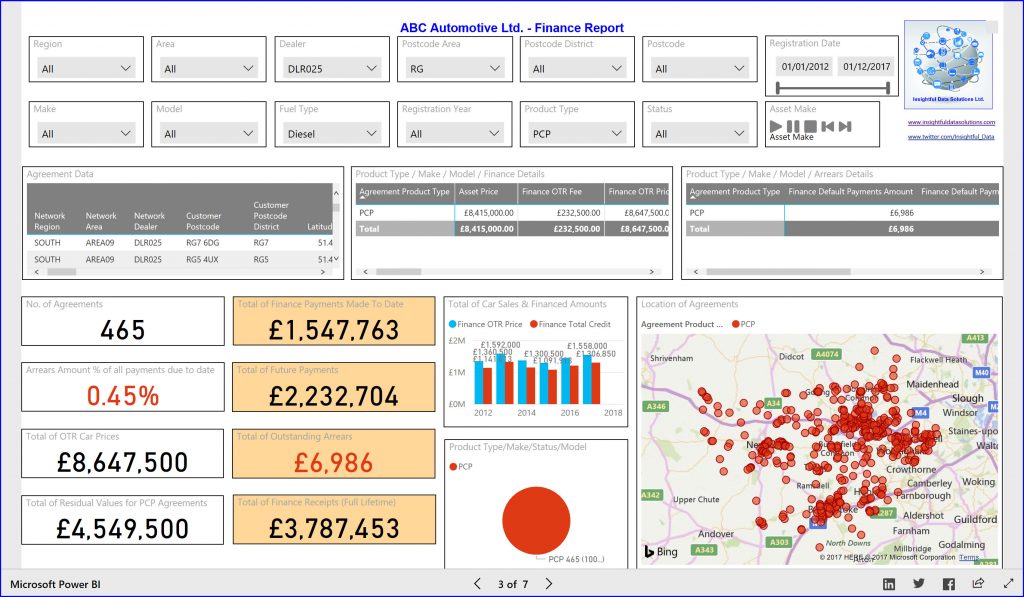
Image 3: Finance report containing a number of different visualisations of data related to financial transactions. Of particular interest are the KPI visualisations that provide a easily viewed status of some of the financial figures for the filtered finance agreements.
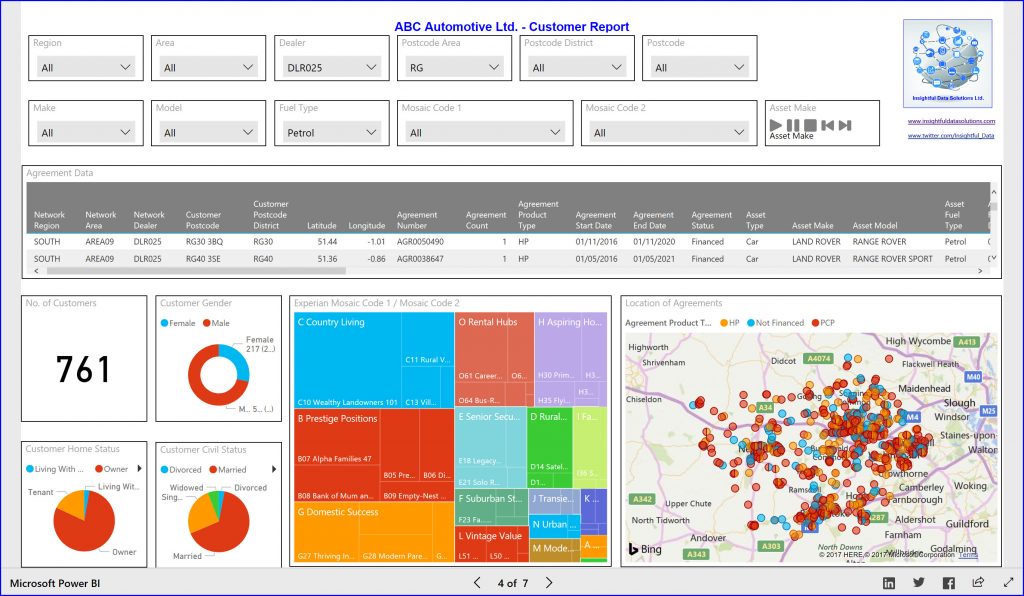
Image 4: Customer report containing a number of different visualisations of data related to the customer. Of particular interest is the “Treemap” visualisation showing the link between the agreement data and external Experian Mosaic customer demographics data.
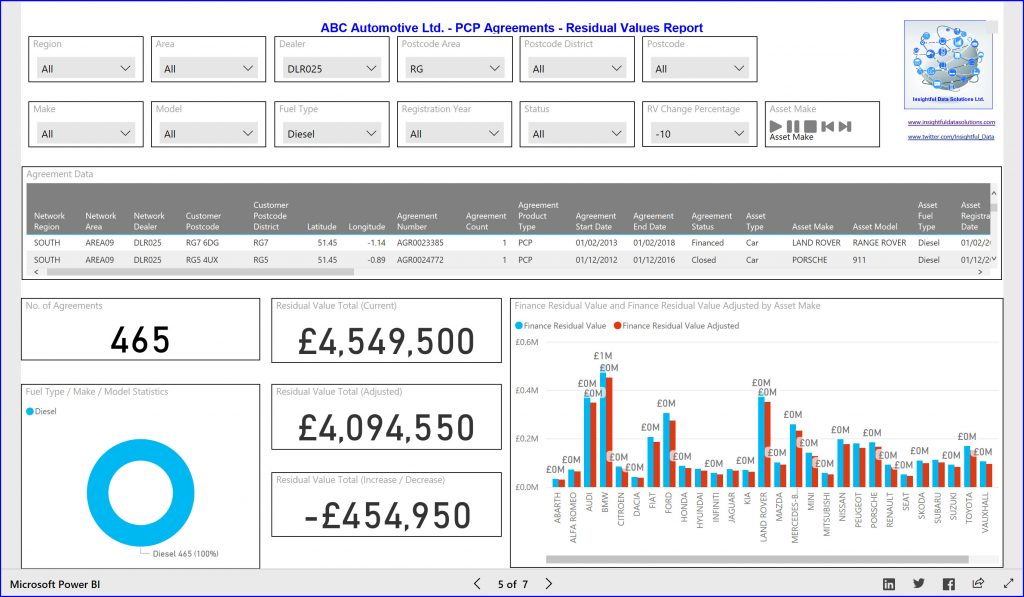
Image 5: Residual Values report containing a number of different visualisations of data related to the residual value of the assets. Of particular interest is the “RV Change Percentage” filter/slicer which allows the user to select a percentage figure that will the dynamically change the displayed residual value totals for all financed agreements.
If a user selects the “Fuel Type” of “Diesel” and selects a percentage change figure it would be possible to see what the reduction in residual values would be in the latest “anti-diesel” climate here in the UK.
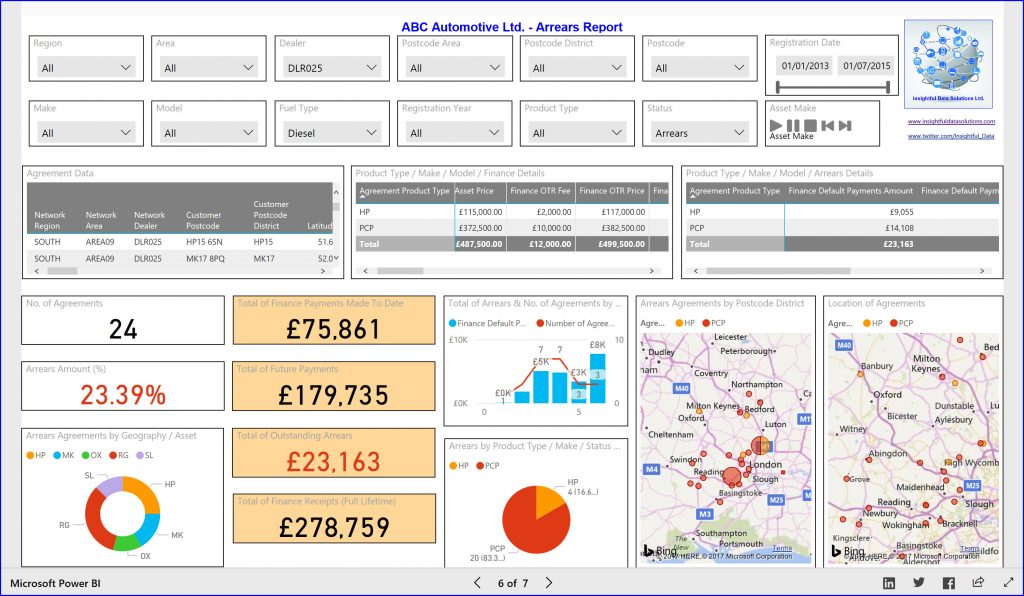
Image 6: Arrears report containing a number of different visualisations of data related to customer arrears.
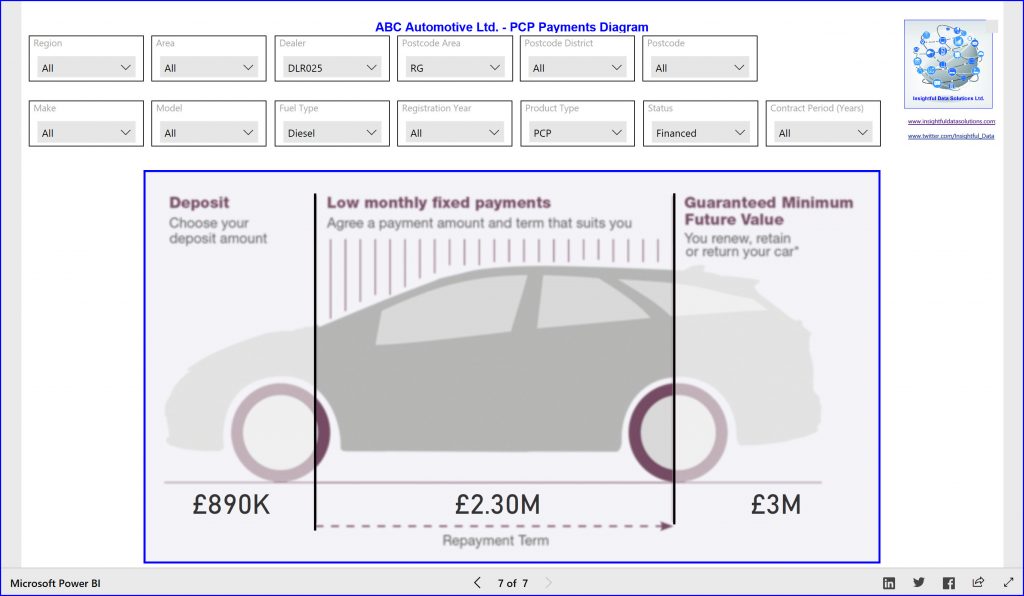
Image 7: A diagram showing the amounts of deposit, monthly payments and residual value (GMFV) for the filtered agreements.
Here’s hoping that this was of interest. If you have any questions feel free to contact me at fred.williams@insightfuldatasolutions.com