Power BI – Viewing Experian Mosaic Data
Whilst working for a client recently I was asked to look into how they could utilise the Experian Mosaic data that they had access to.
Following are the results of this particular exercise. It should be noted that the reports shown here do not display any of the client’s own data and some of the Experian Mosaic data has been “redacted” to hide the part of the key that would identify individual addresses.
However, the reports should illustrate how the Experian Mosaic data can be linked, via Royal Mail Postcode Unit and Postcode District codes to a companies’ own data, if it contains geographic links (postcode, lat/long etc.)
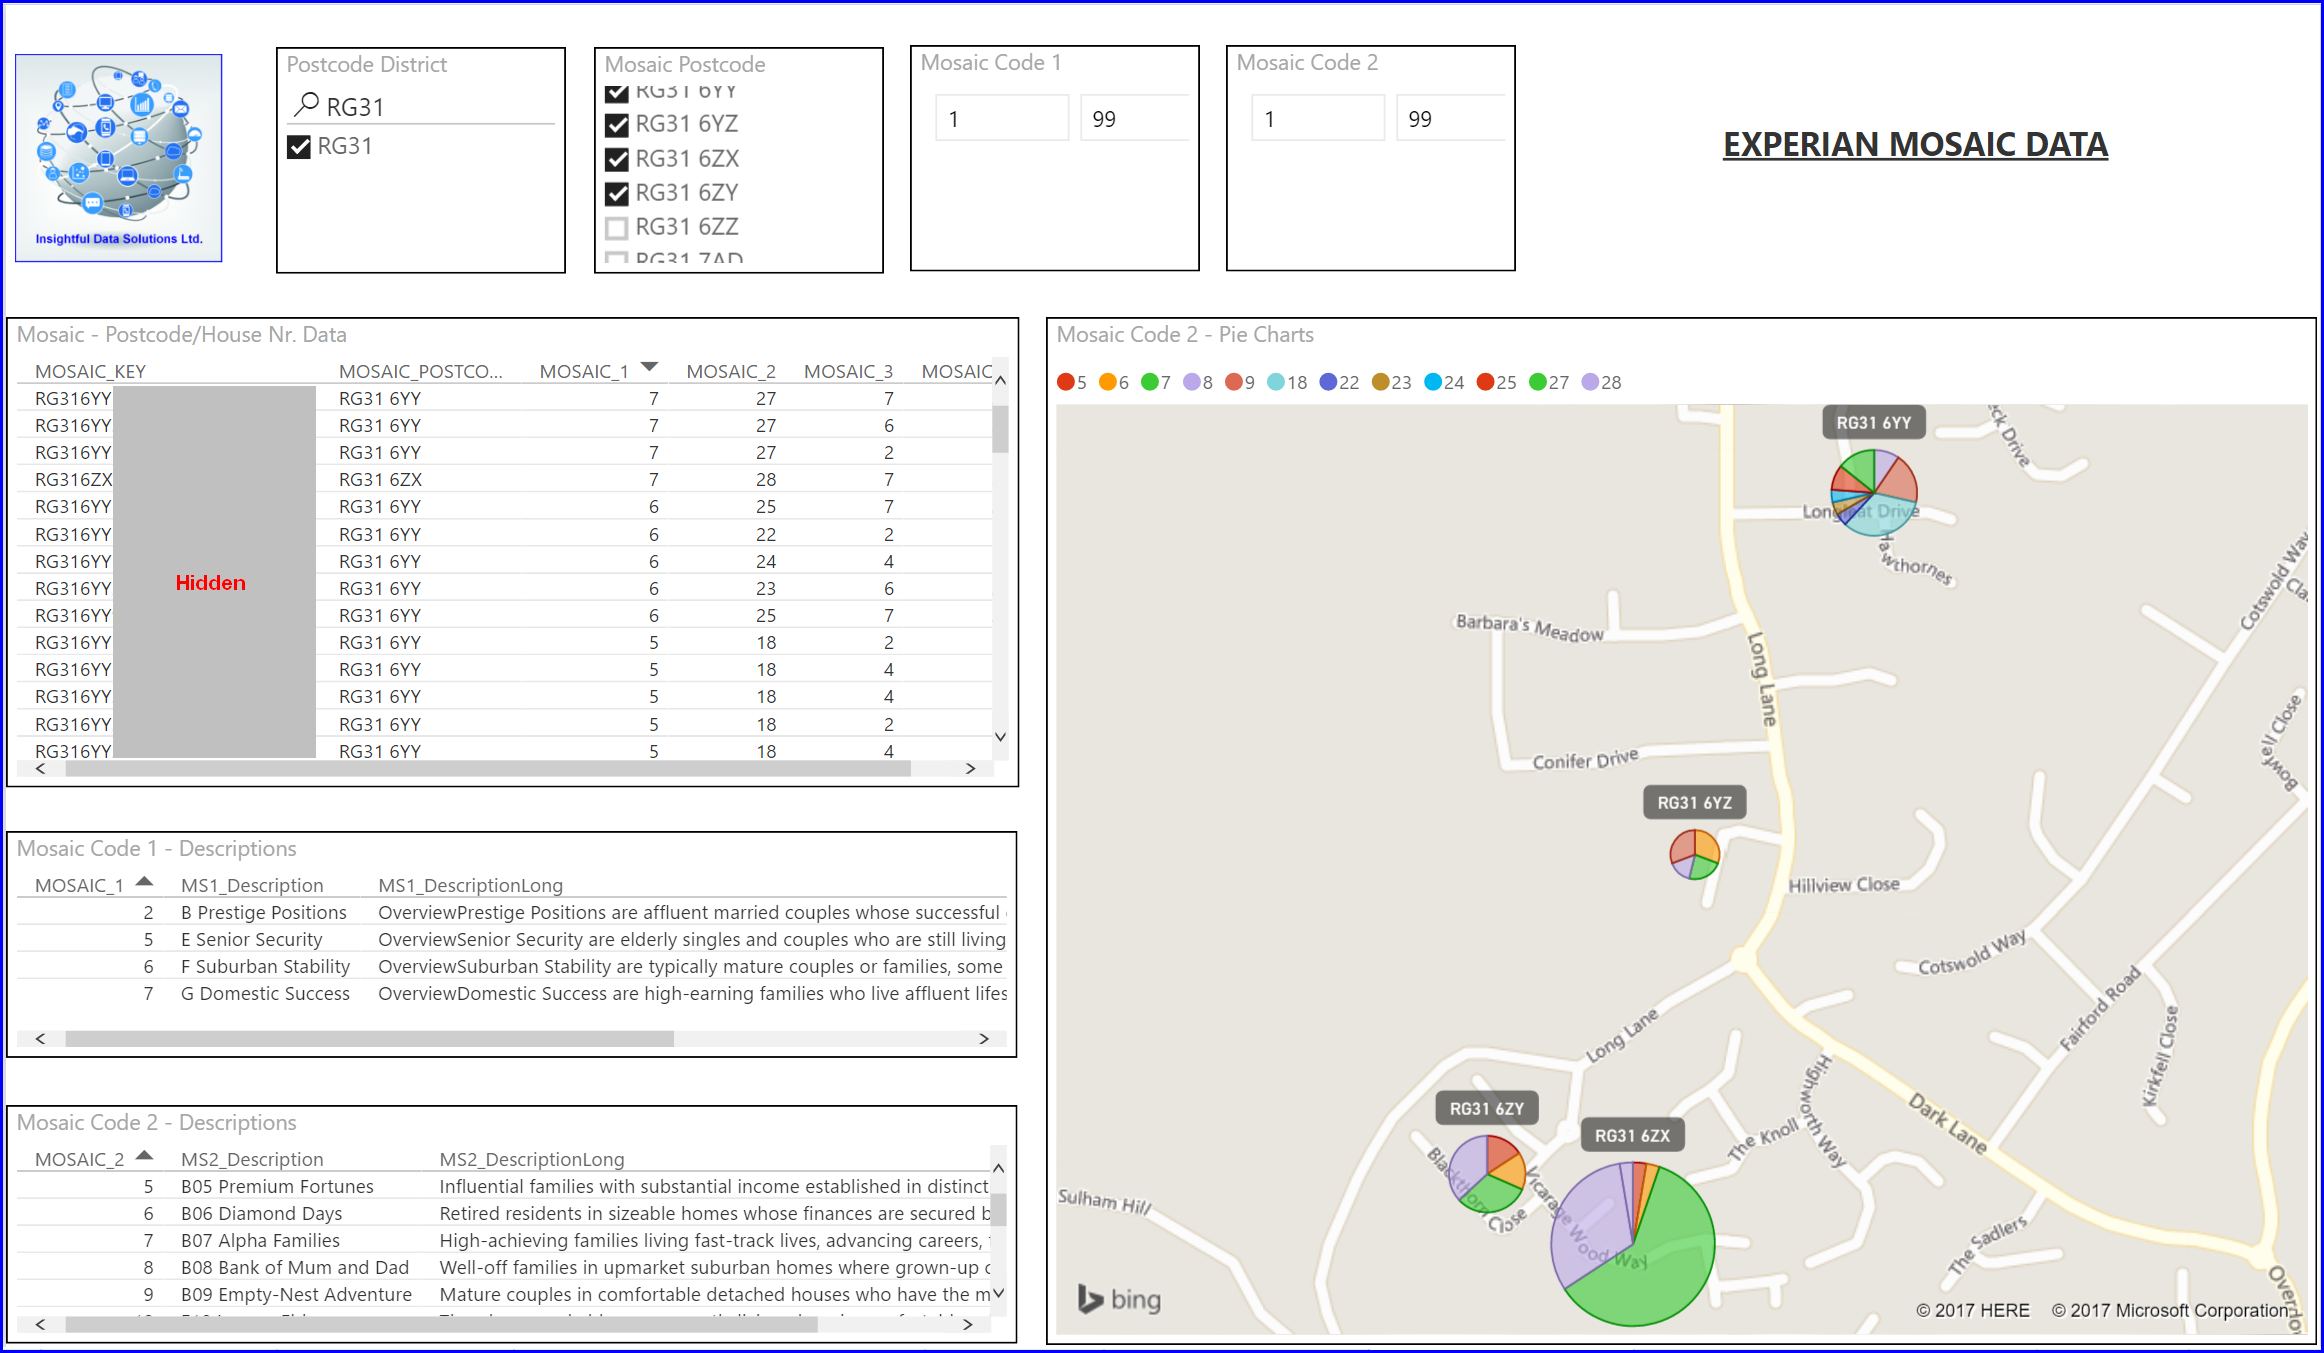
Image 1 This report has “slicers” that enable the user to select the Postcode District, Postcode Unit and a range of values for the “Mosaic_Code_1” and “Mosiac_Code_2” codes for which they want to have data displayed. This requires that the complete set of Experian Mosaic data i.e. 28,114,093 records, one for each individual address in the United Kingdom, has to be loaded. No problem for Microsoft Power BI!
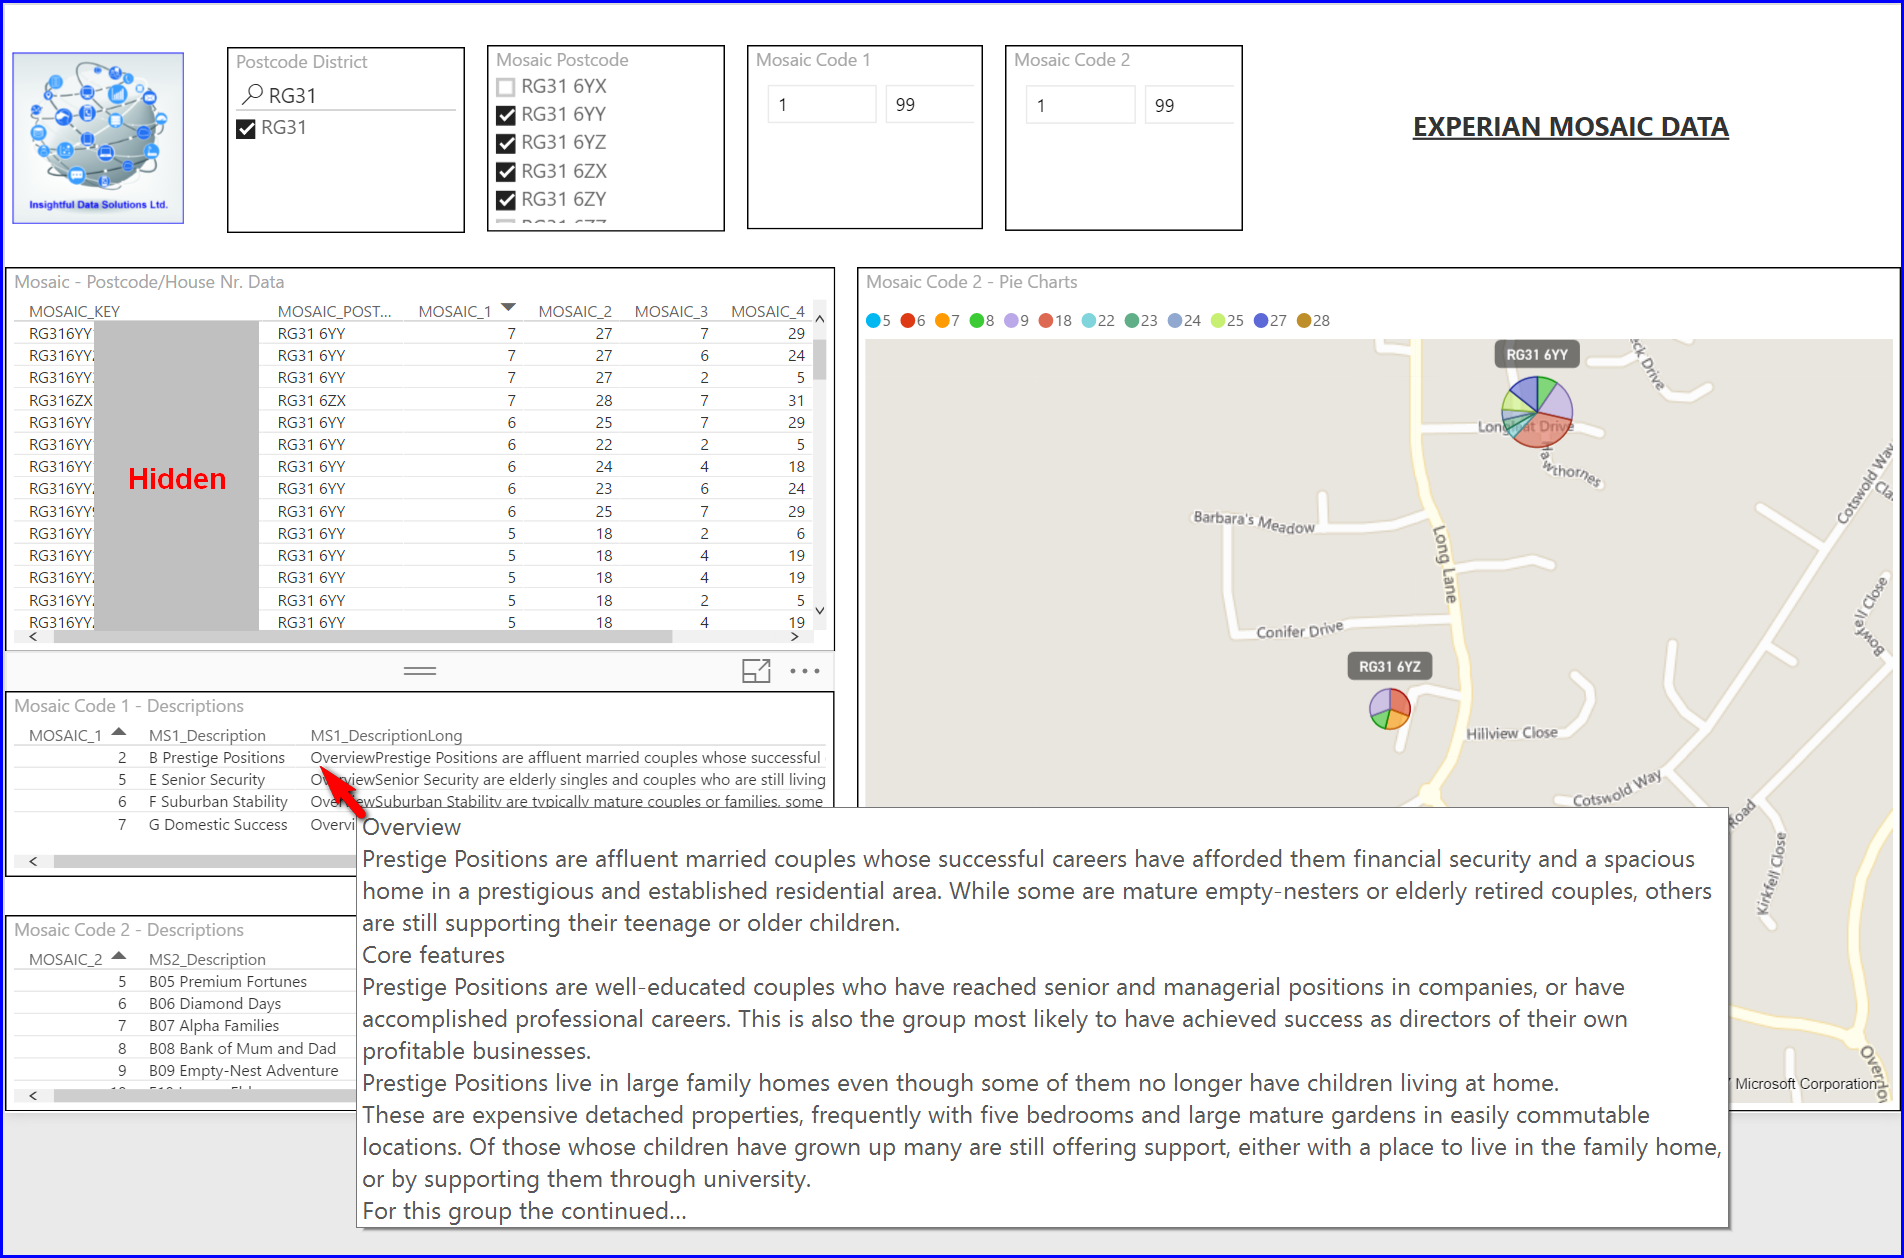
Image 2 Hovering over the “MS1_DescriptionLong” column provides a very interesting description for those addresses with the “Mosaic_1” code with a value of “2” referring to “B Prestige Positions”.
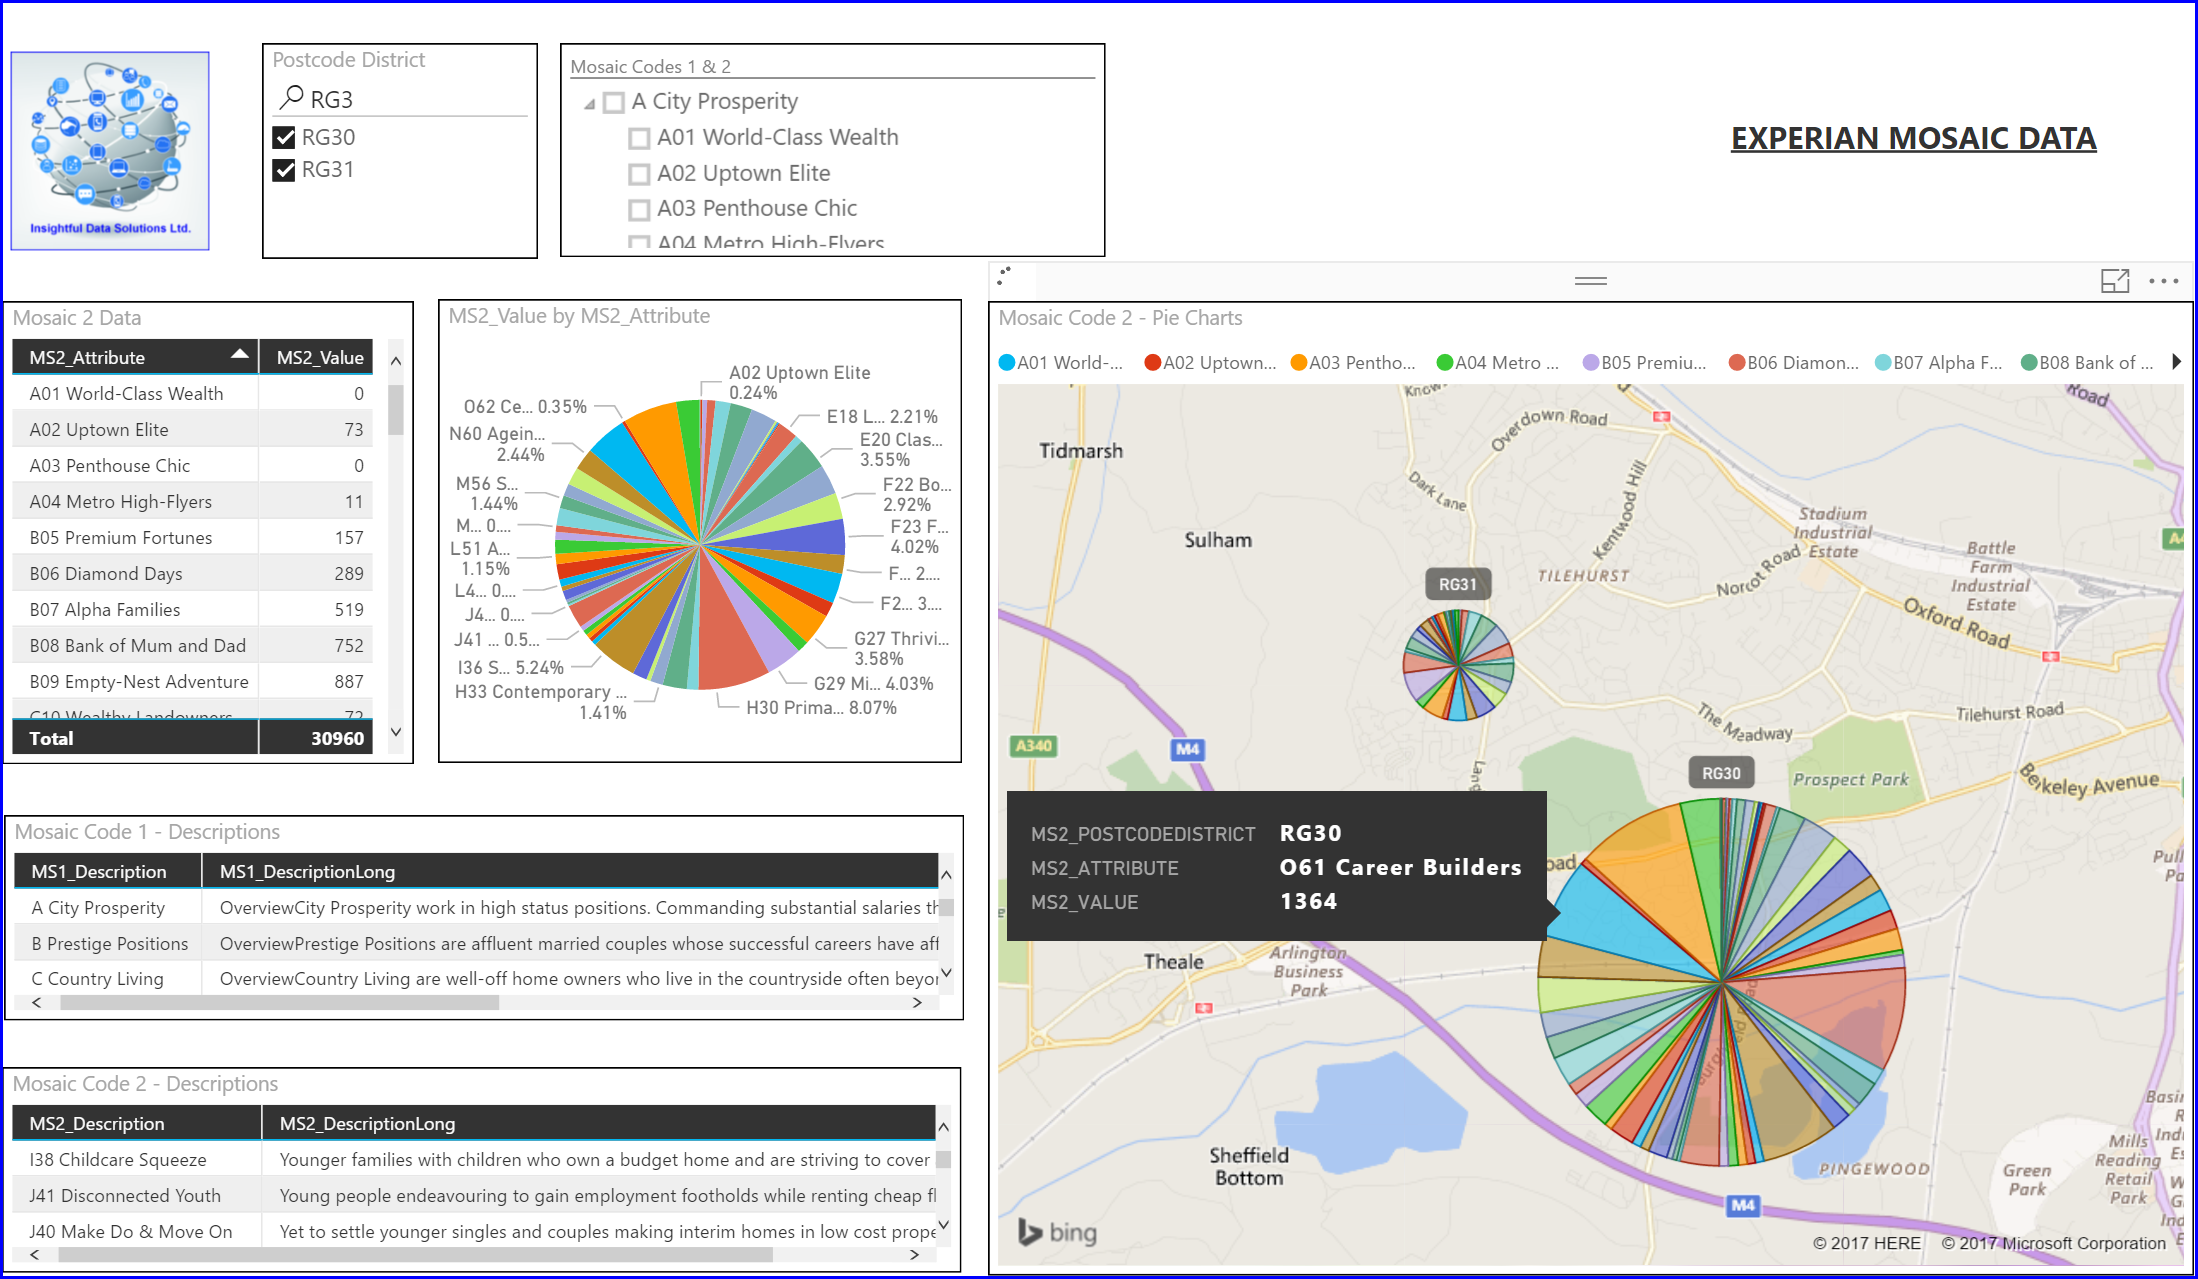
Image 3 This report has “slicers” that enable the user to select the Postcode District and hierarchical values for the “Mosaic_Code_1” and “Mosiac_Code_2” codes for which they want to have data displayed.
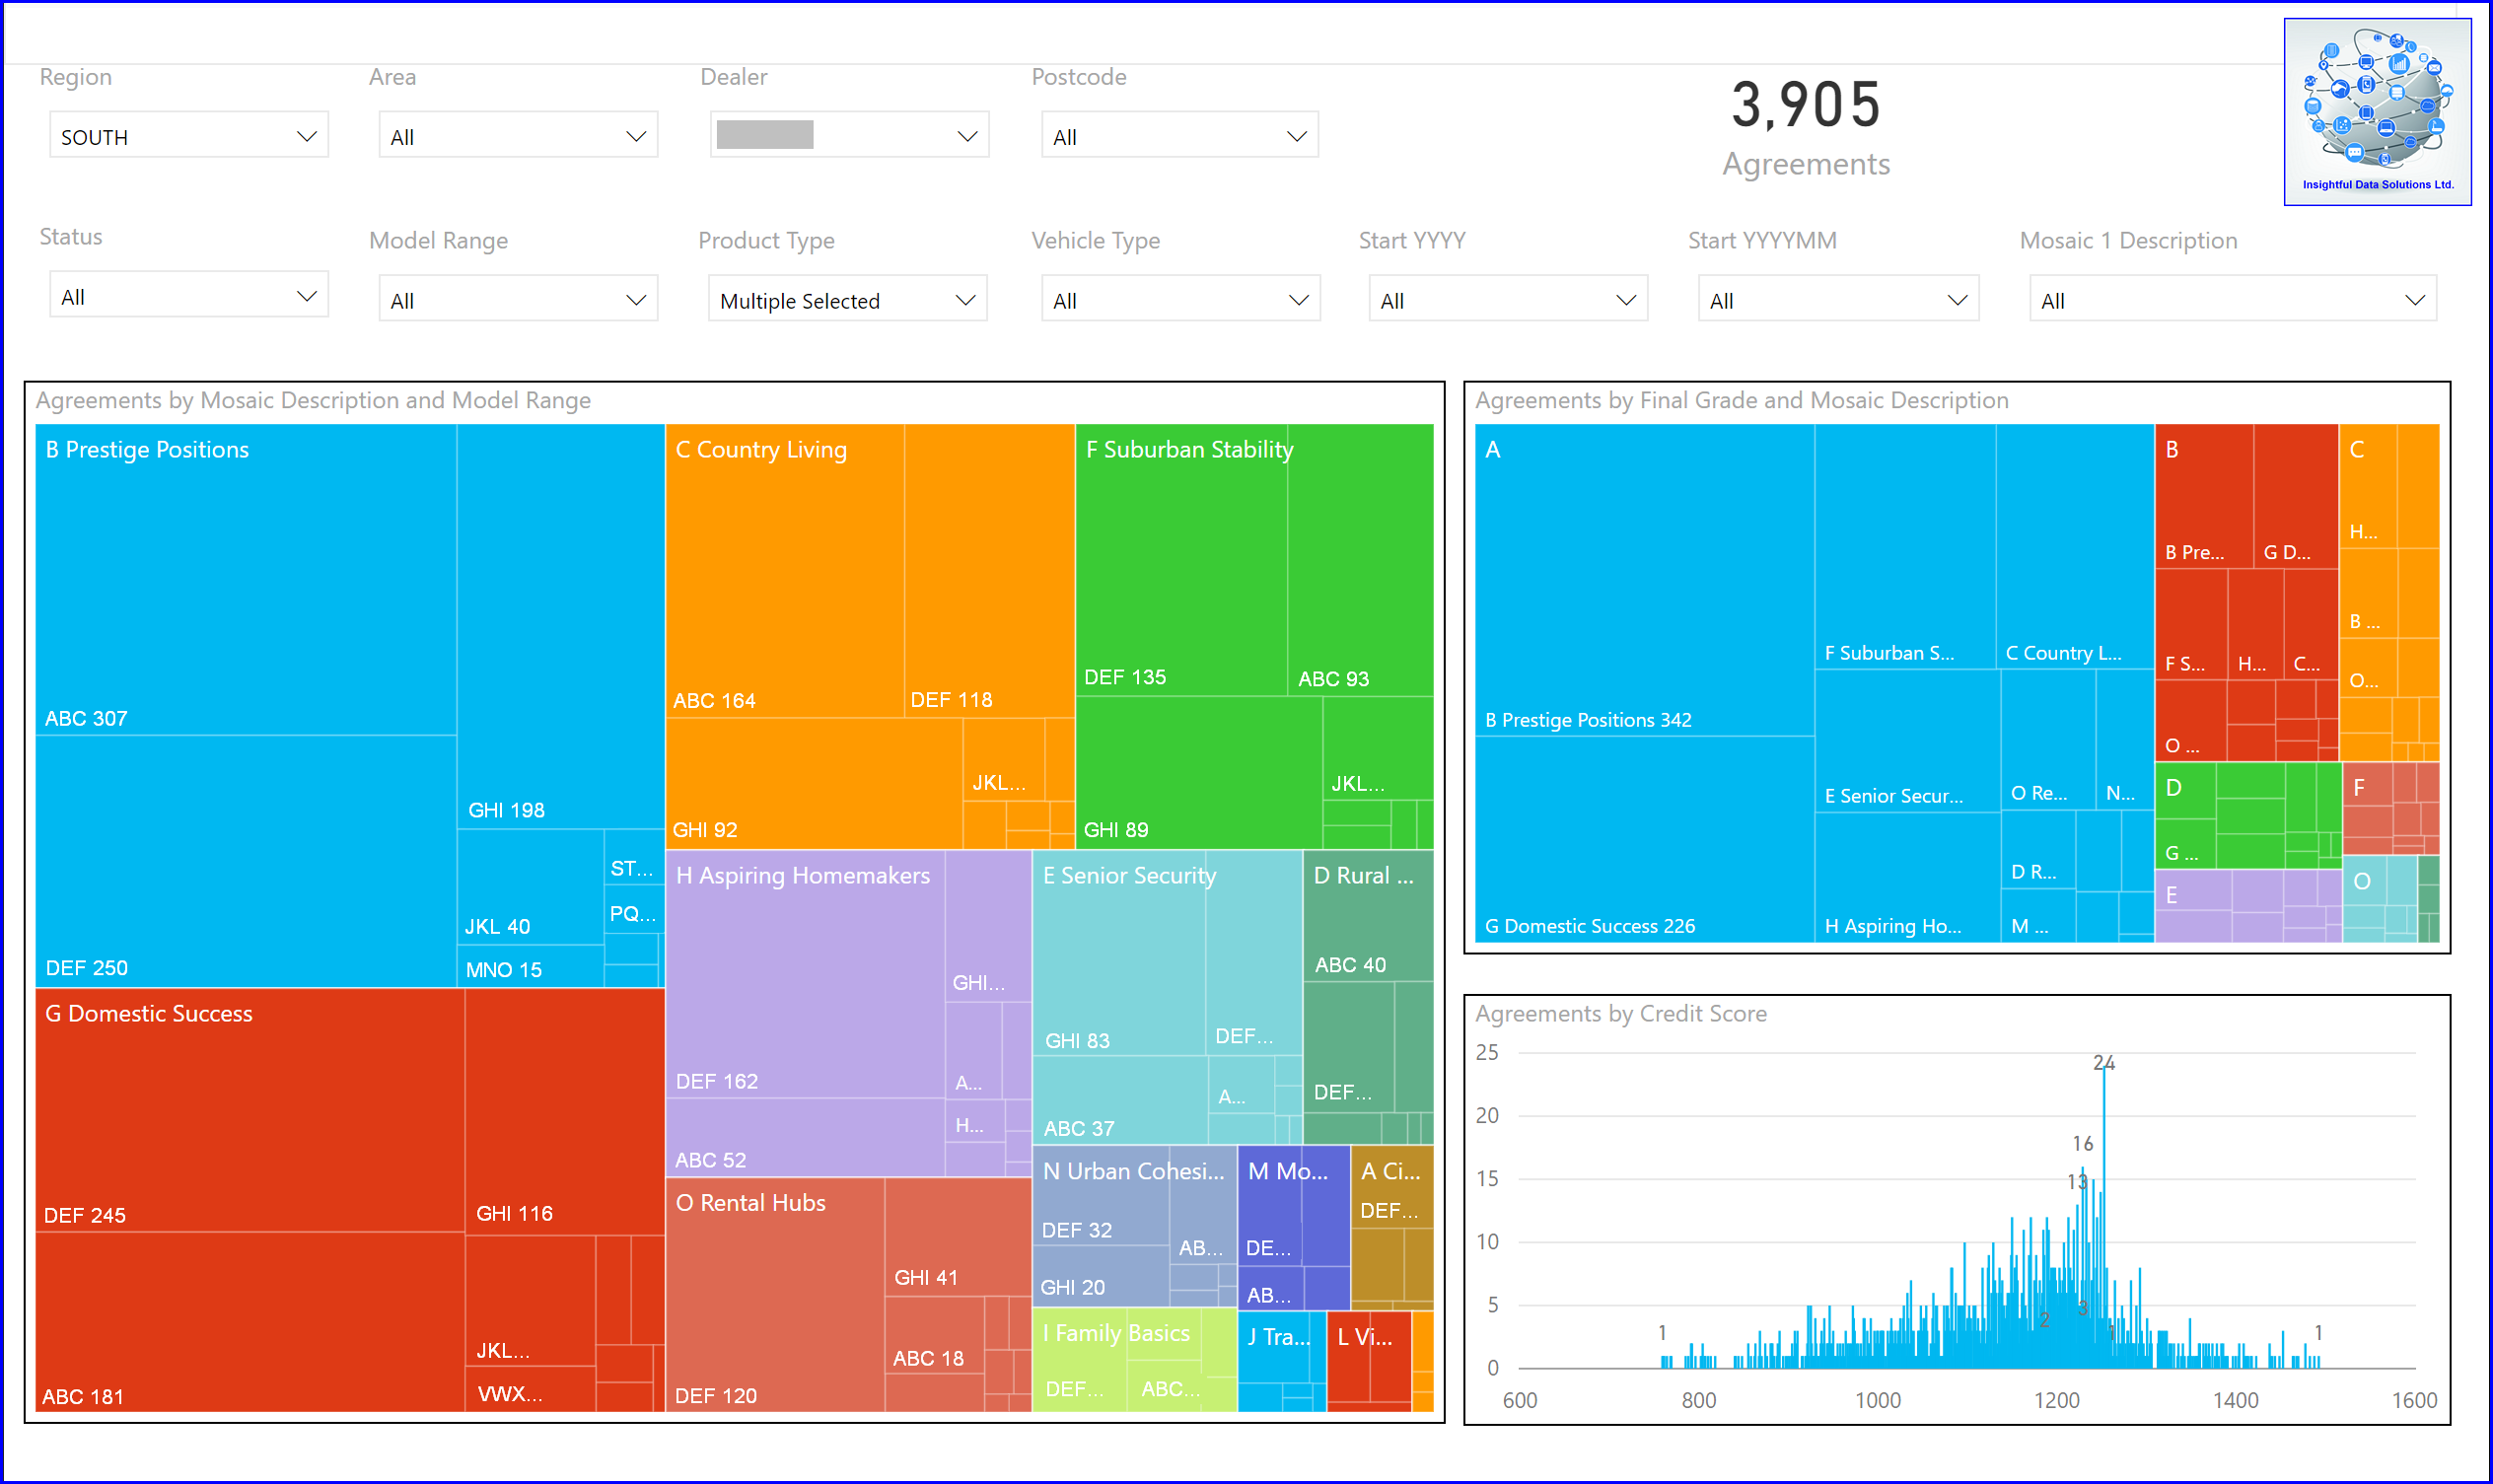
Image 4 A report with “TreeMaps” showing how the Experian Mosaic data can be connected to other data. In this case “Car Model Agreements” (“ABC”, “DEF”, “GHI” etc…) and “Credit Score Grades” (“A”, “B”, “C” etc.).
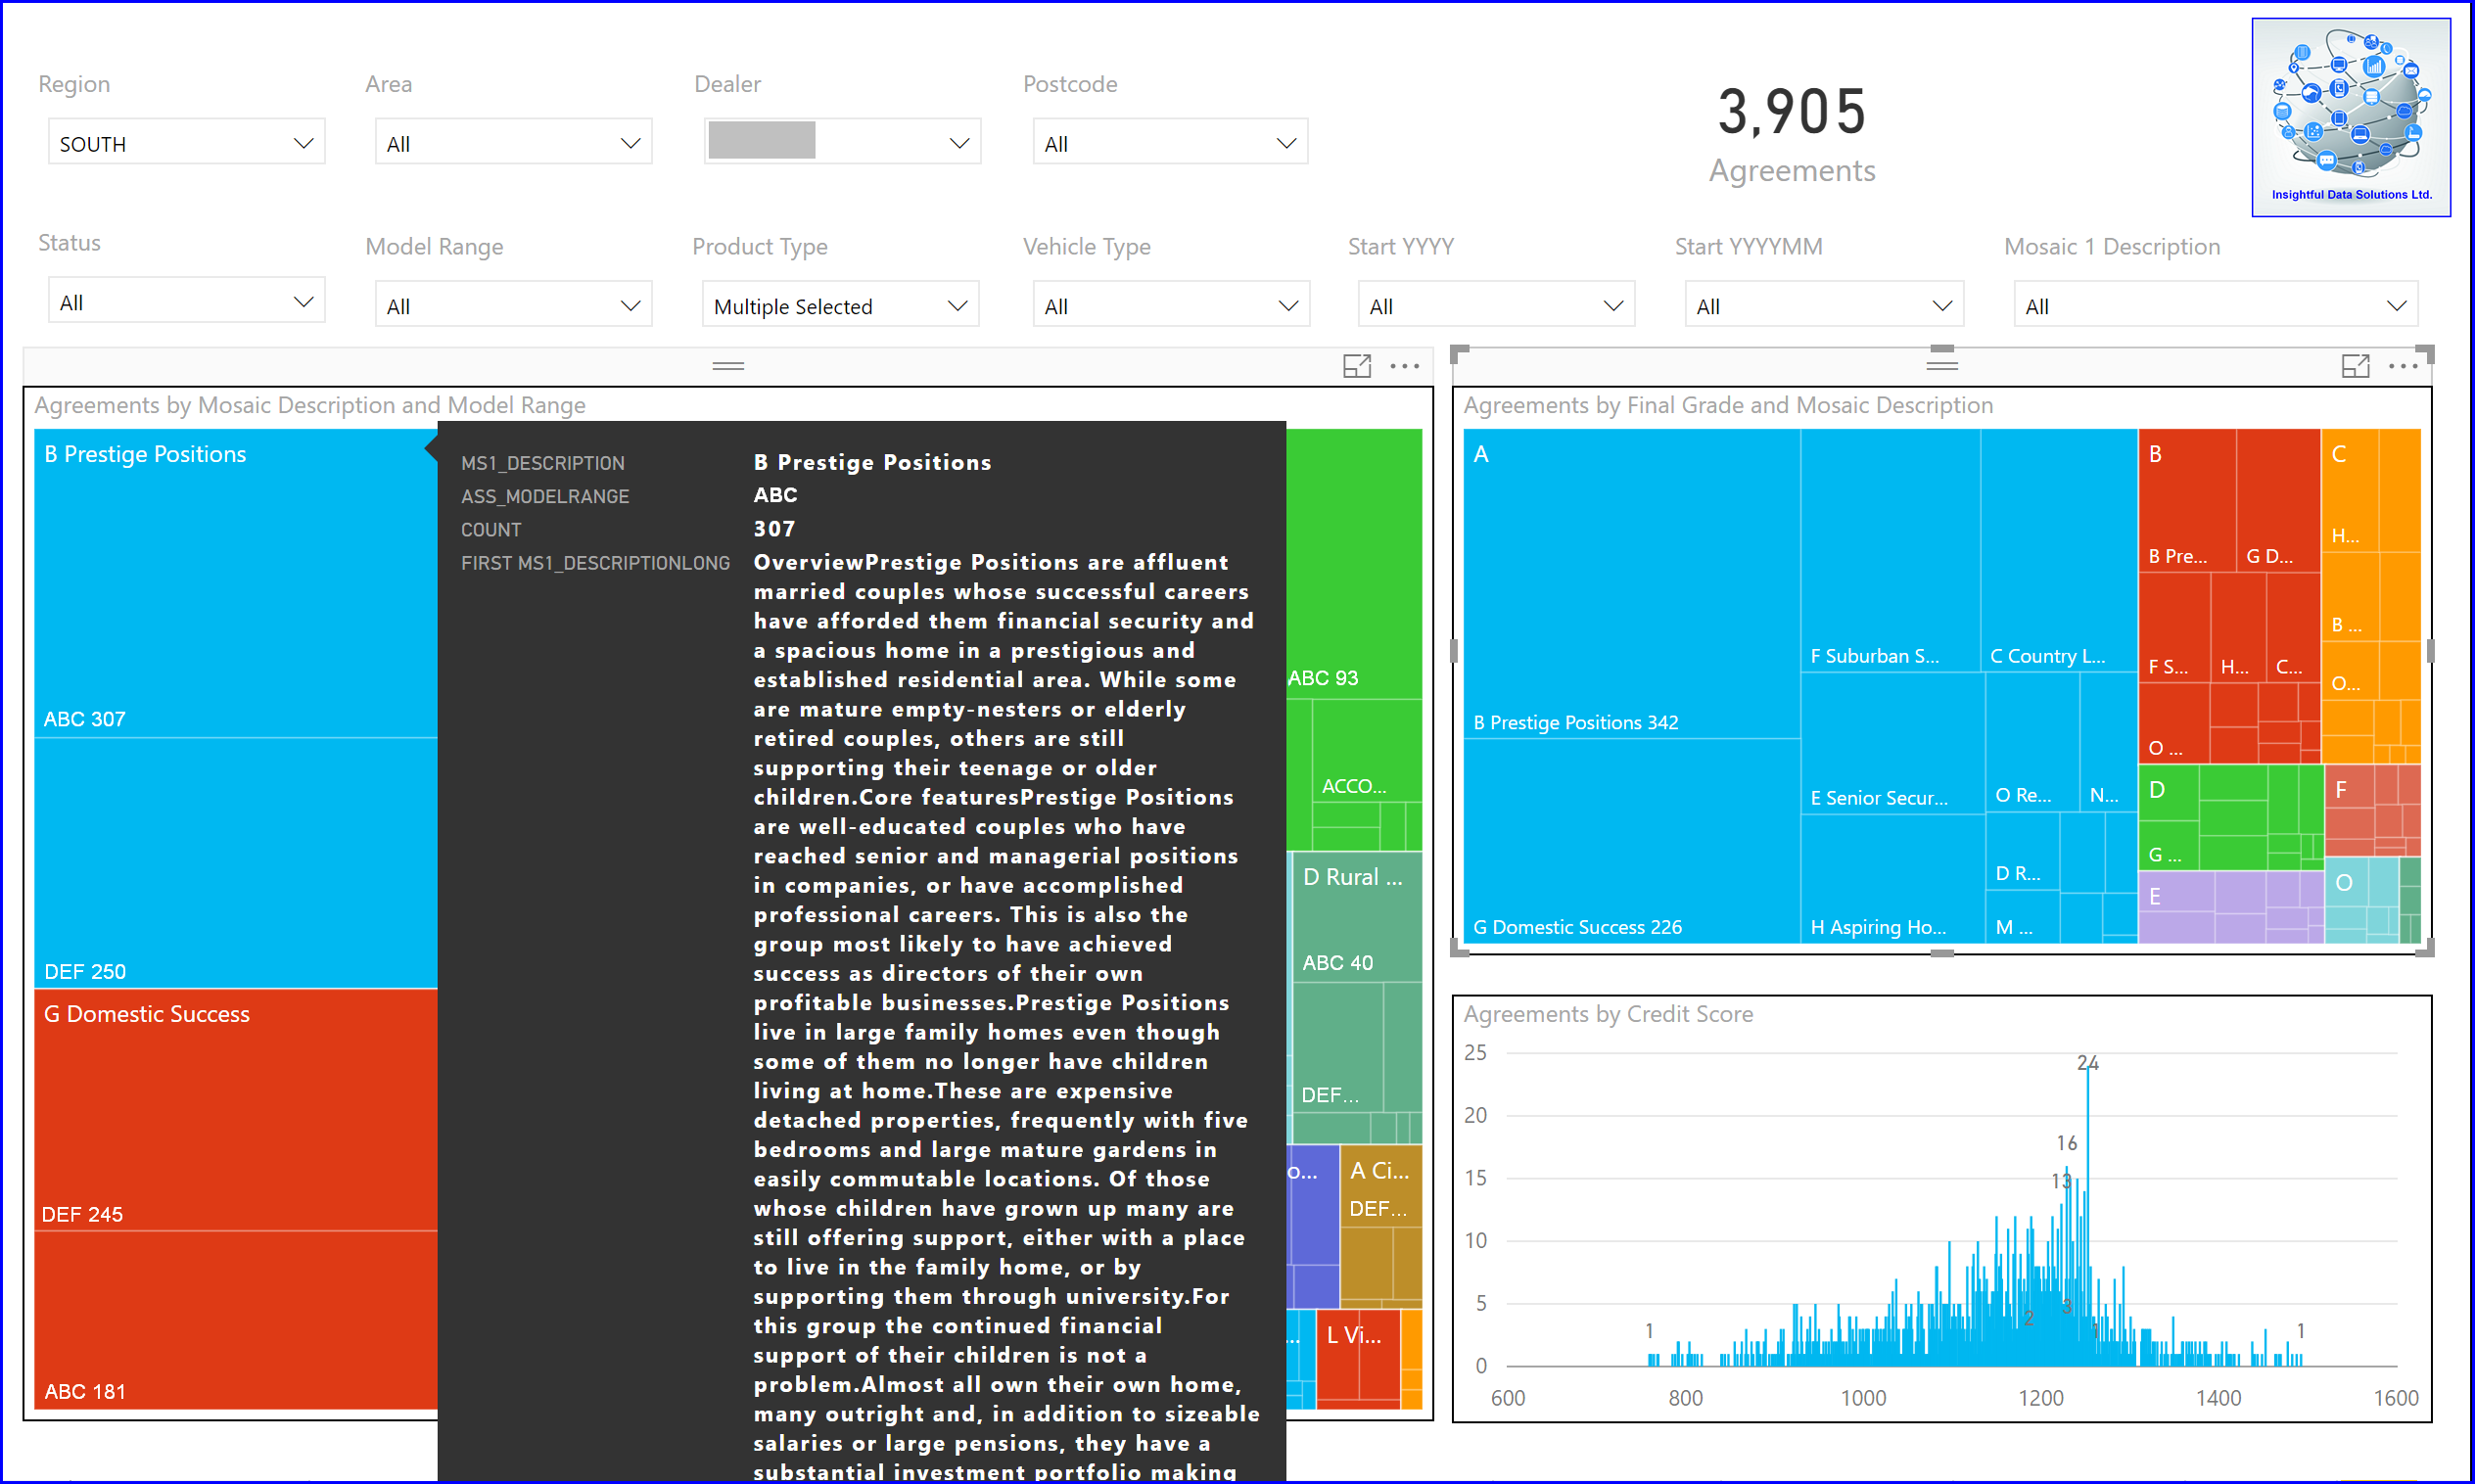
Image 5 A report with “TreeMaps” showing how the Experian Mosaic data can be connected to other data. The “Tooltip” shows an expanded text for “B Prestige Positions” category.
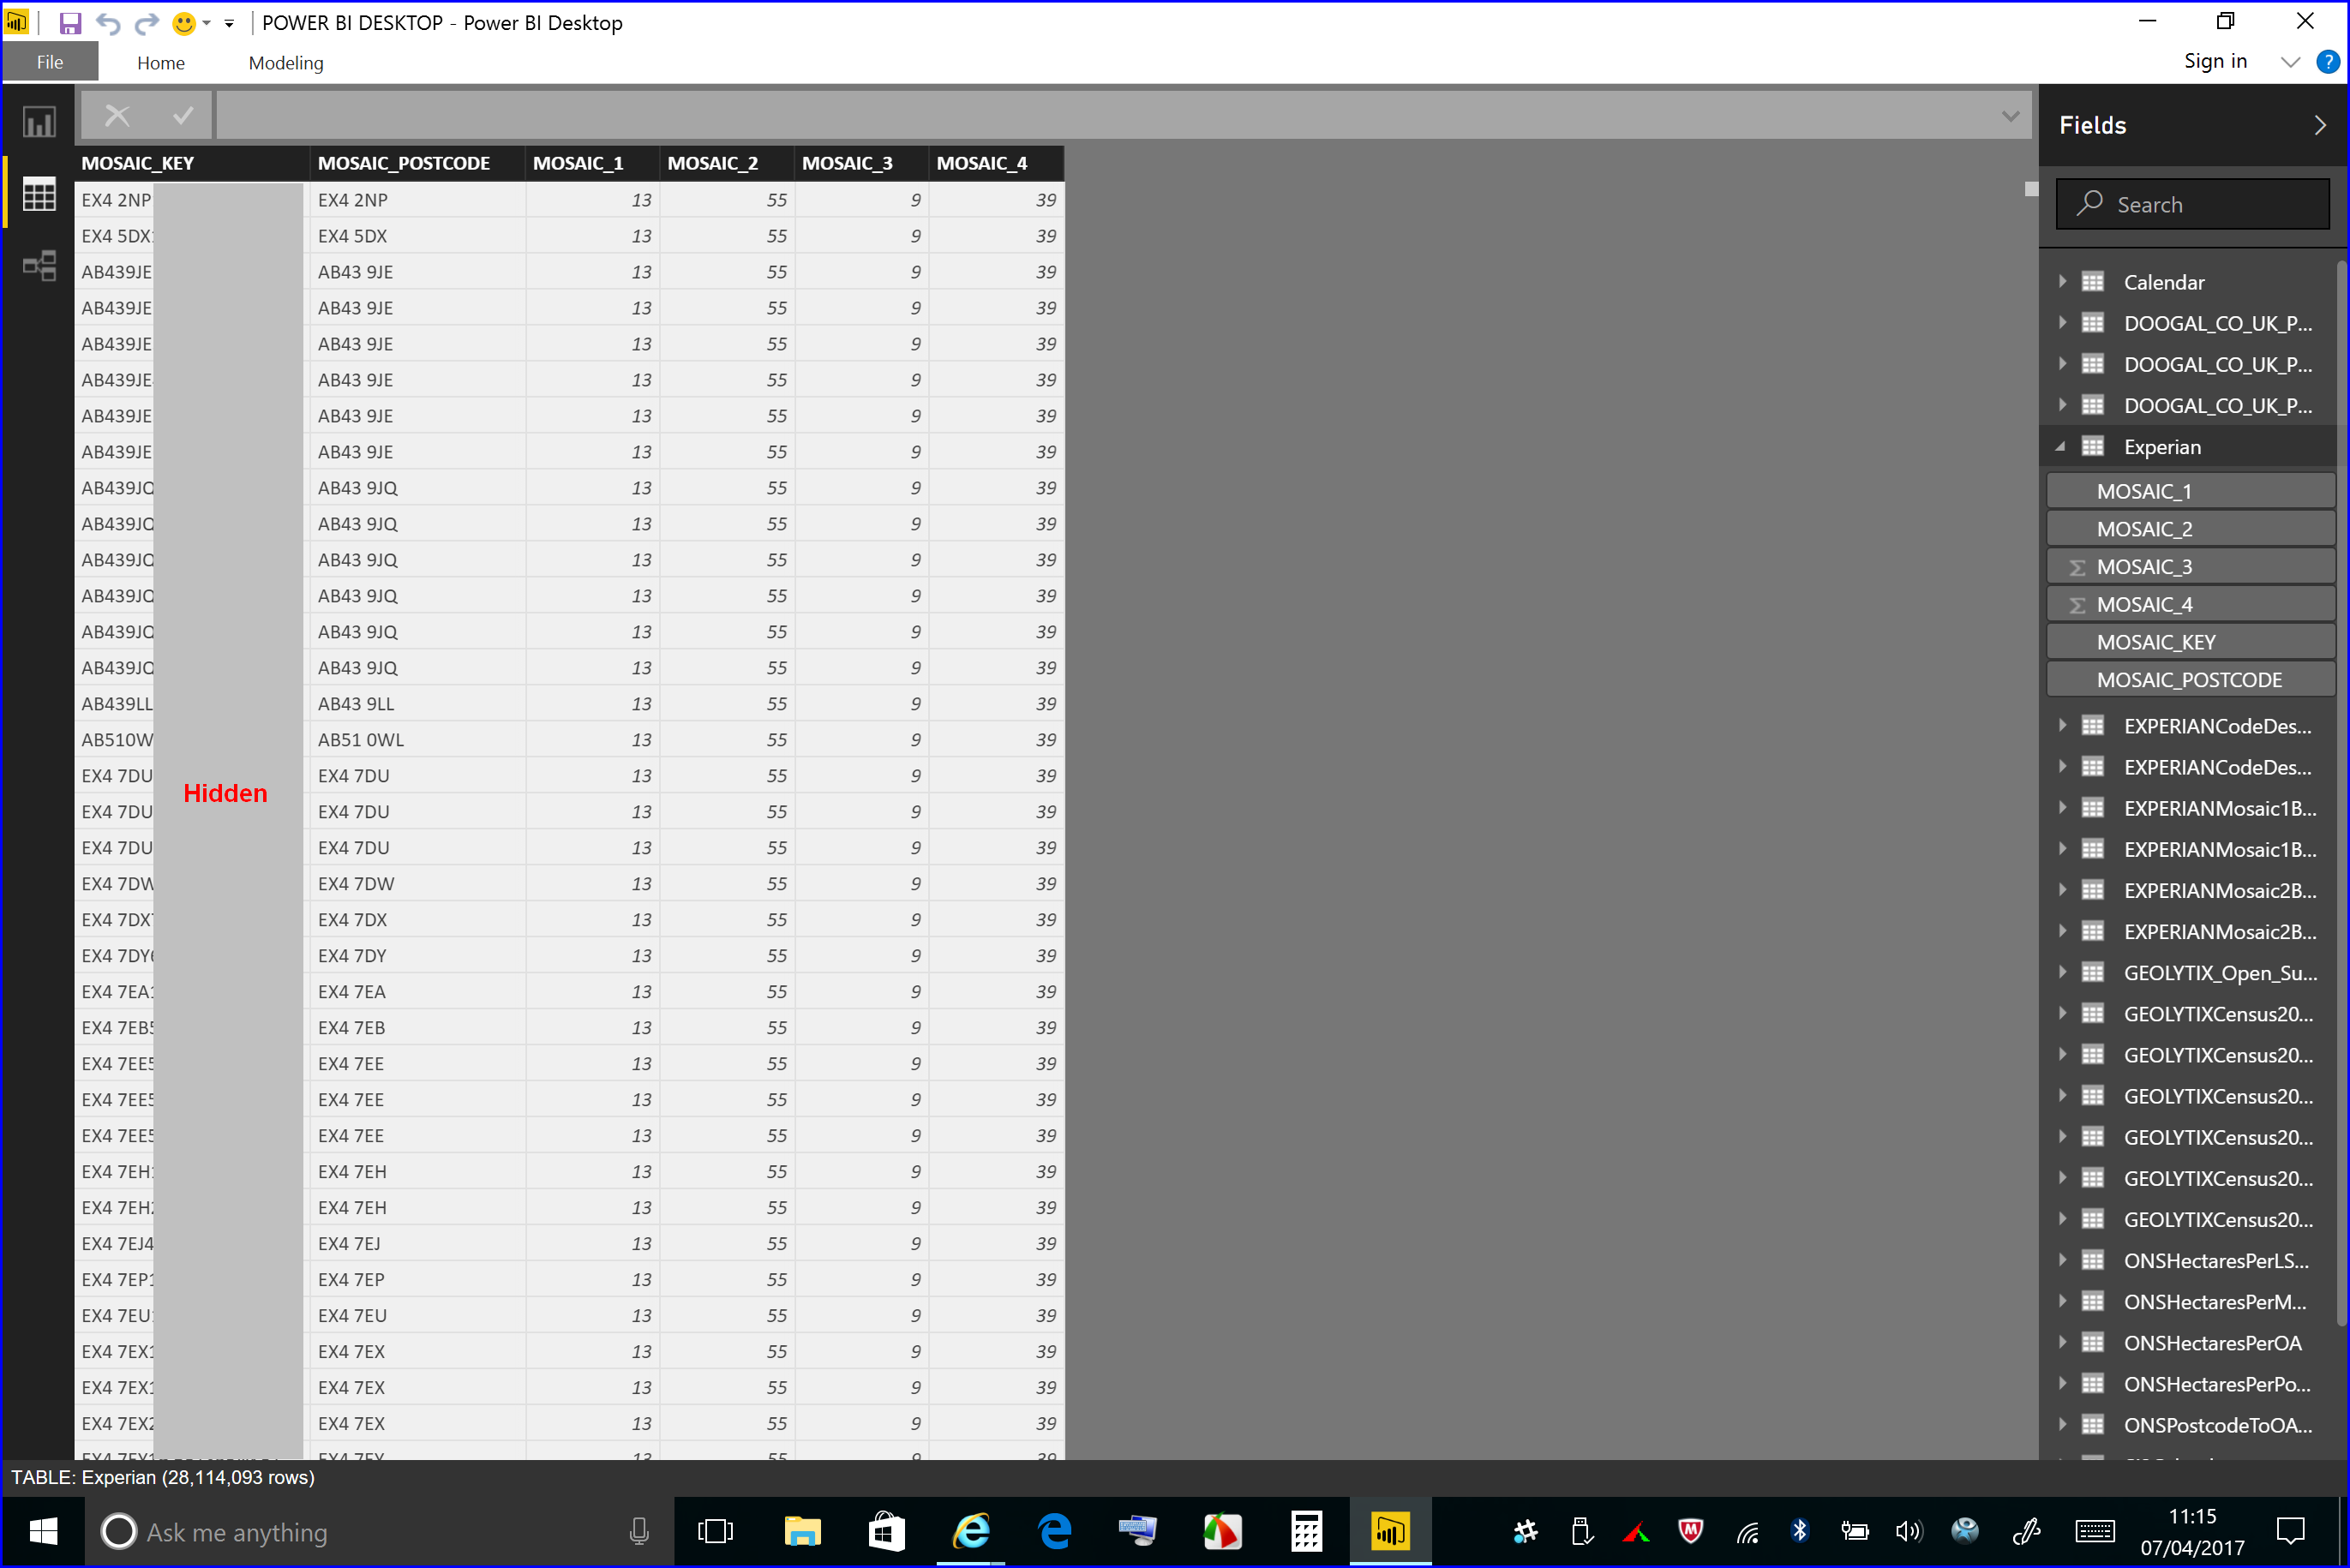
Image 6 Complete set of Experian Mosaic data, in it’s original format, i.e. 28,114,093 million records, one for each address in the United Kingdom. No problem for Microsoft Power BI!
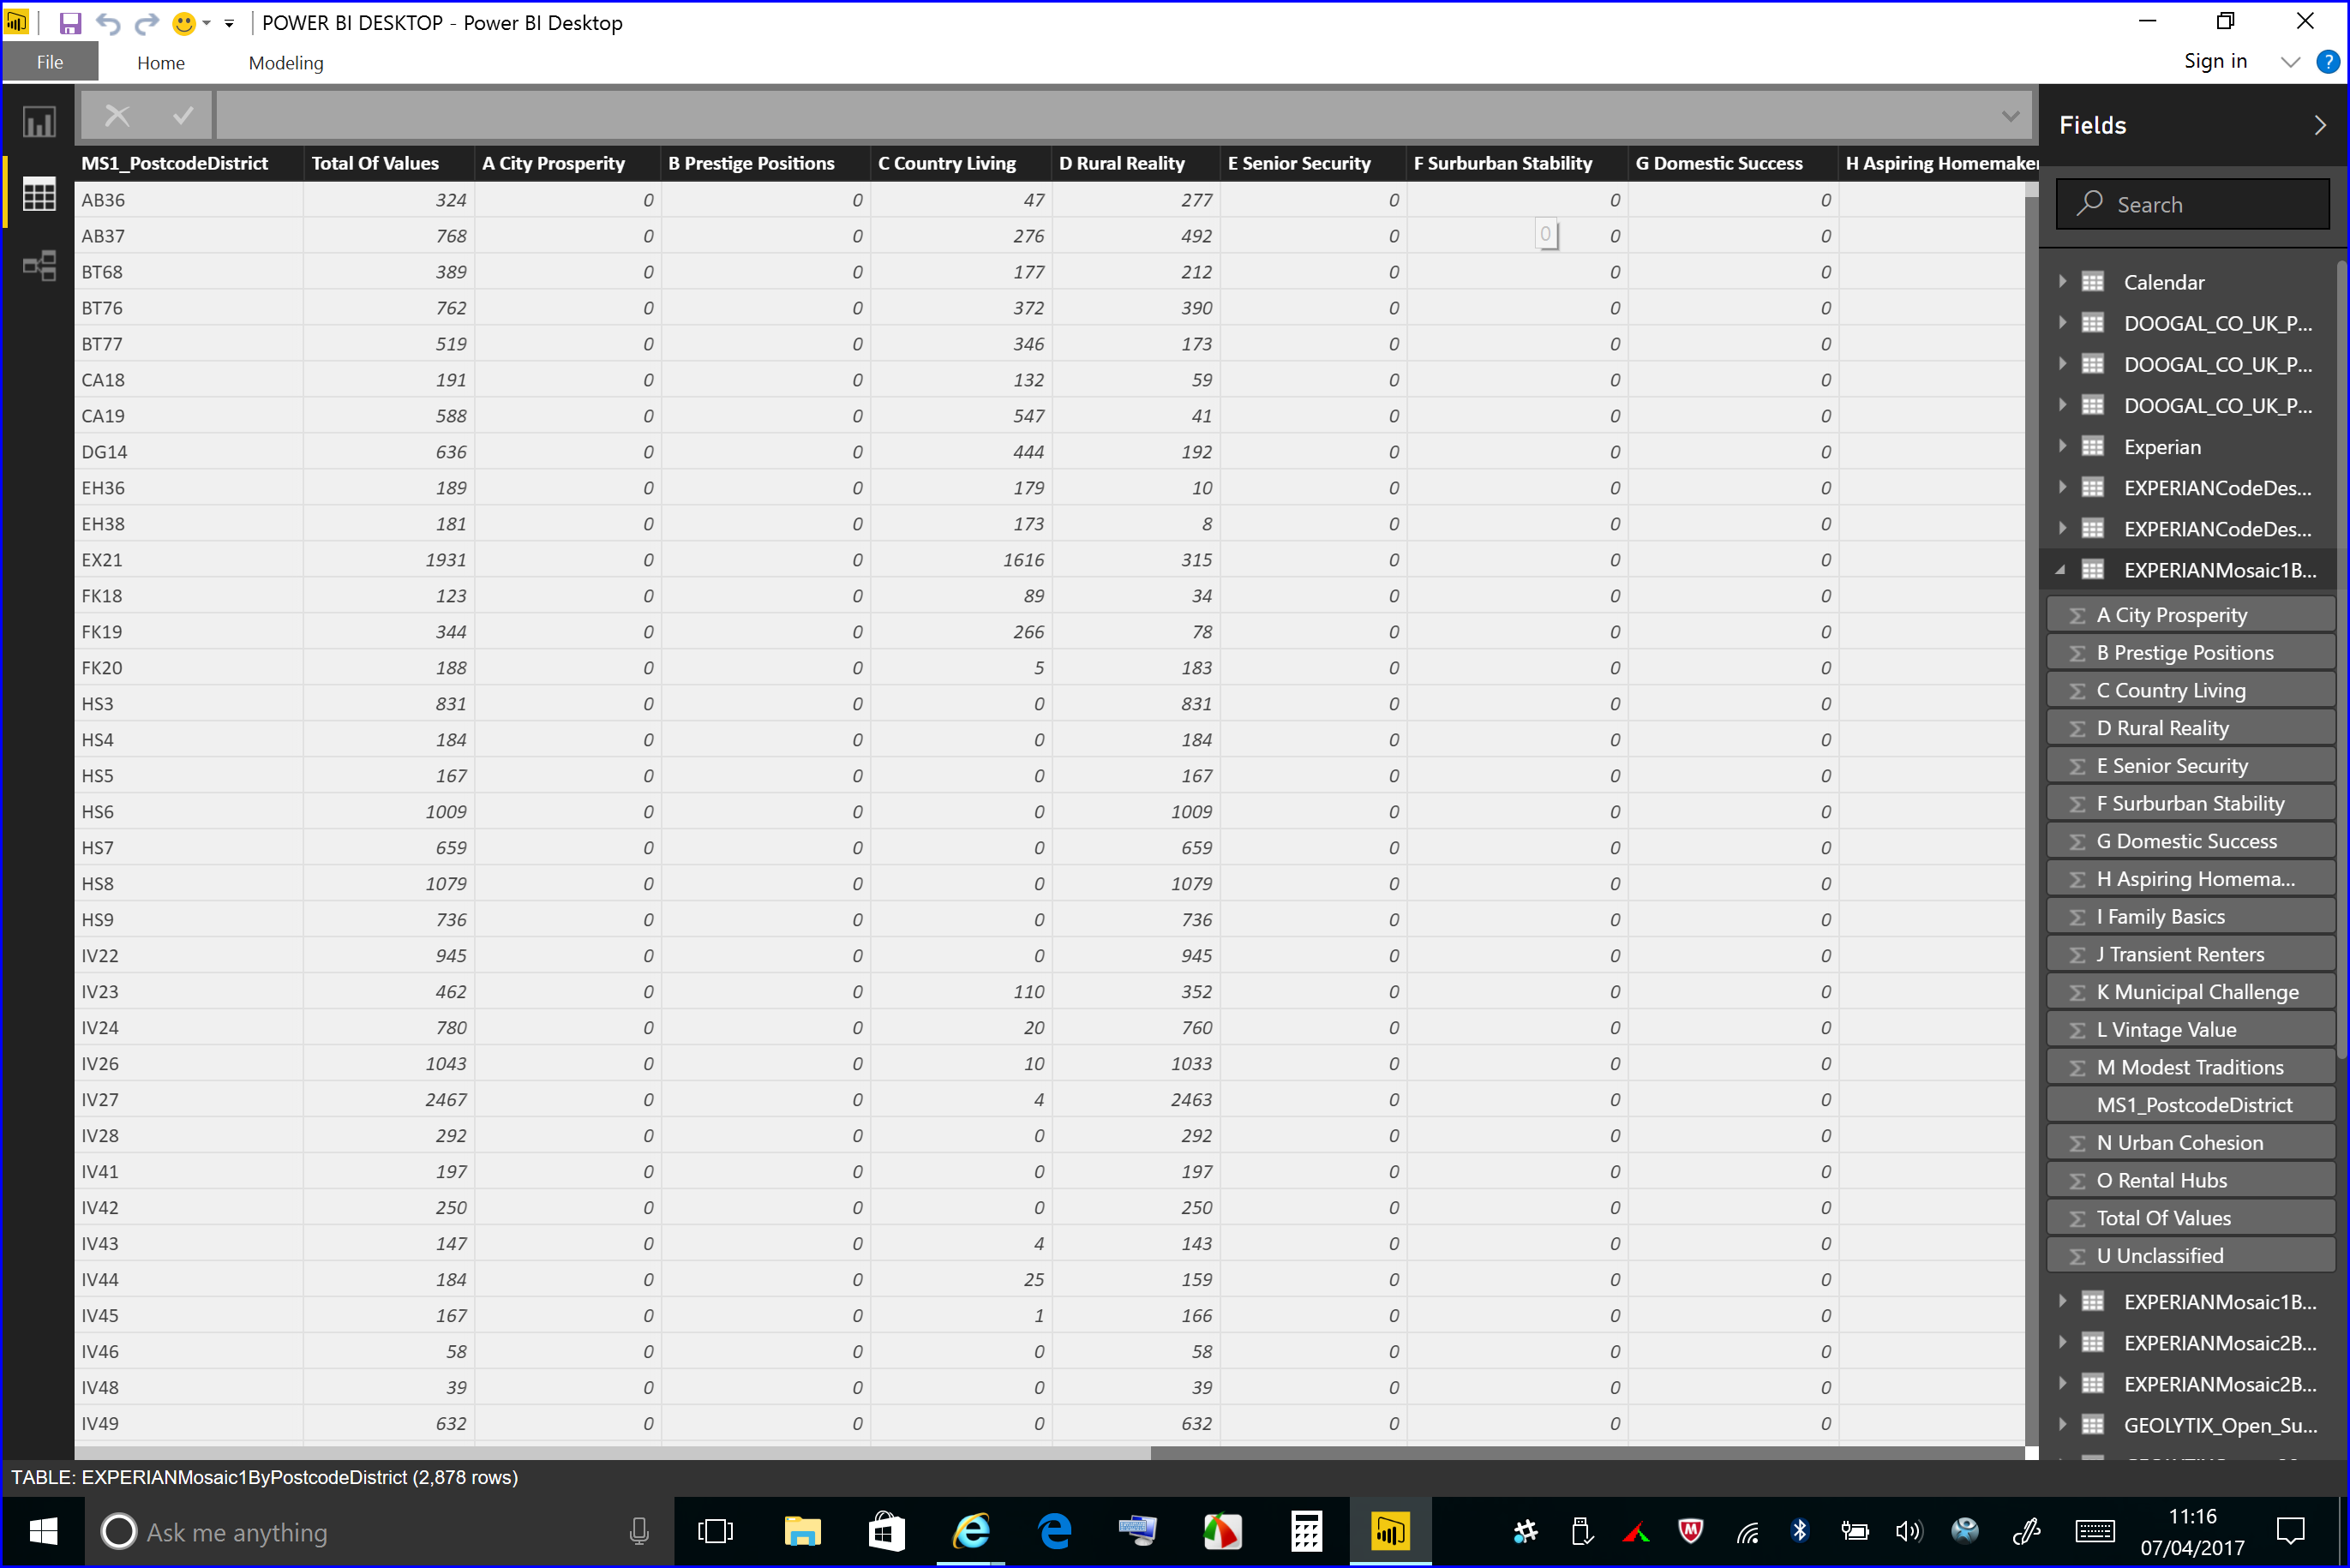
Image 7 This shows the Mosaic 1 data after it has been aggregated and transformed using Microsoft Access 2016 using a “CrossTab” query to the Postcode District code level.
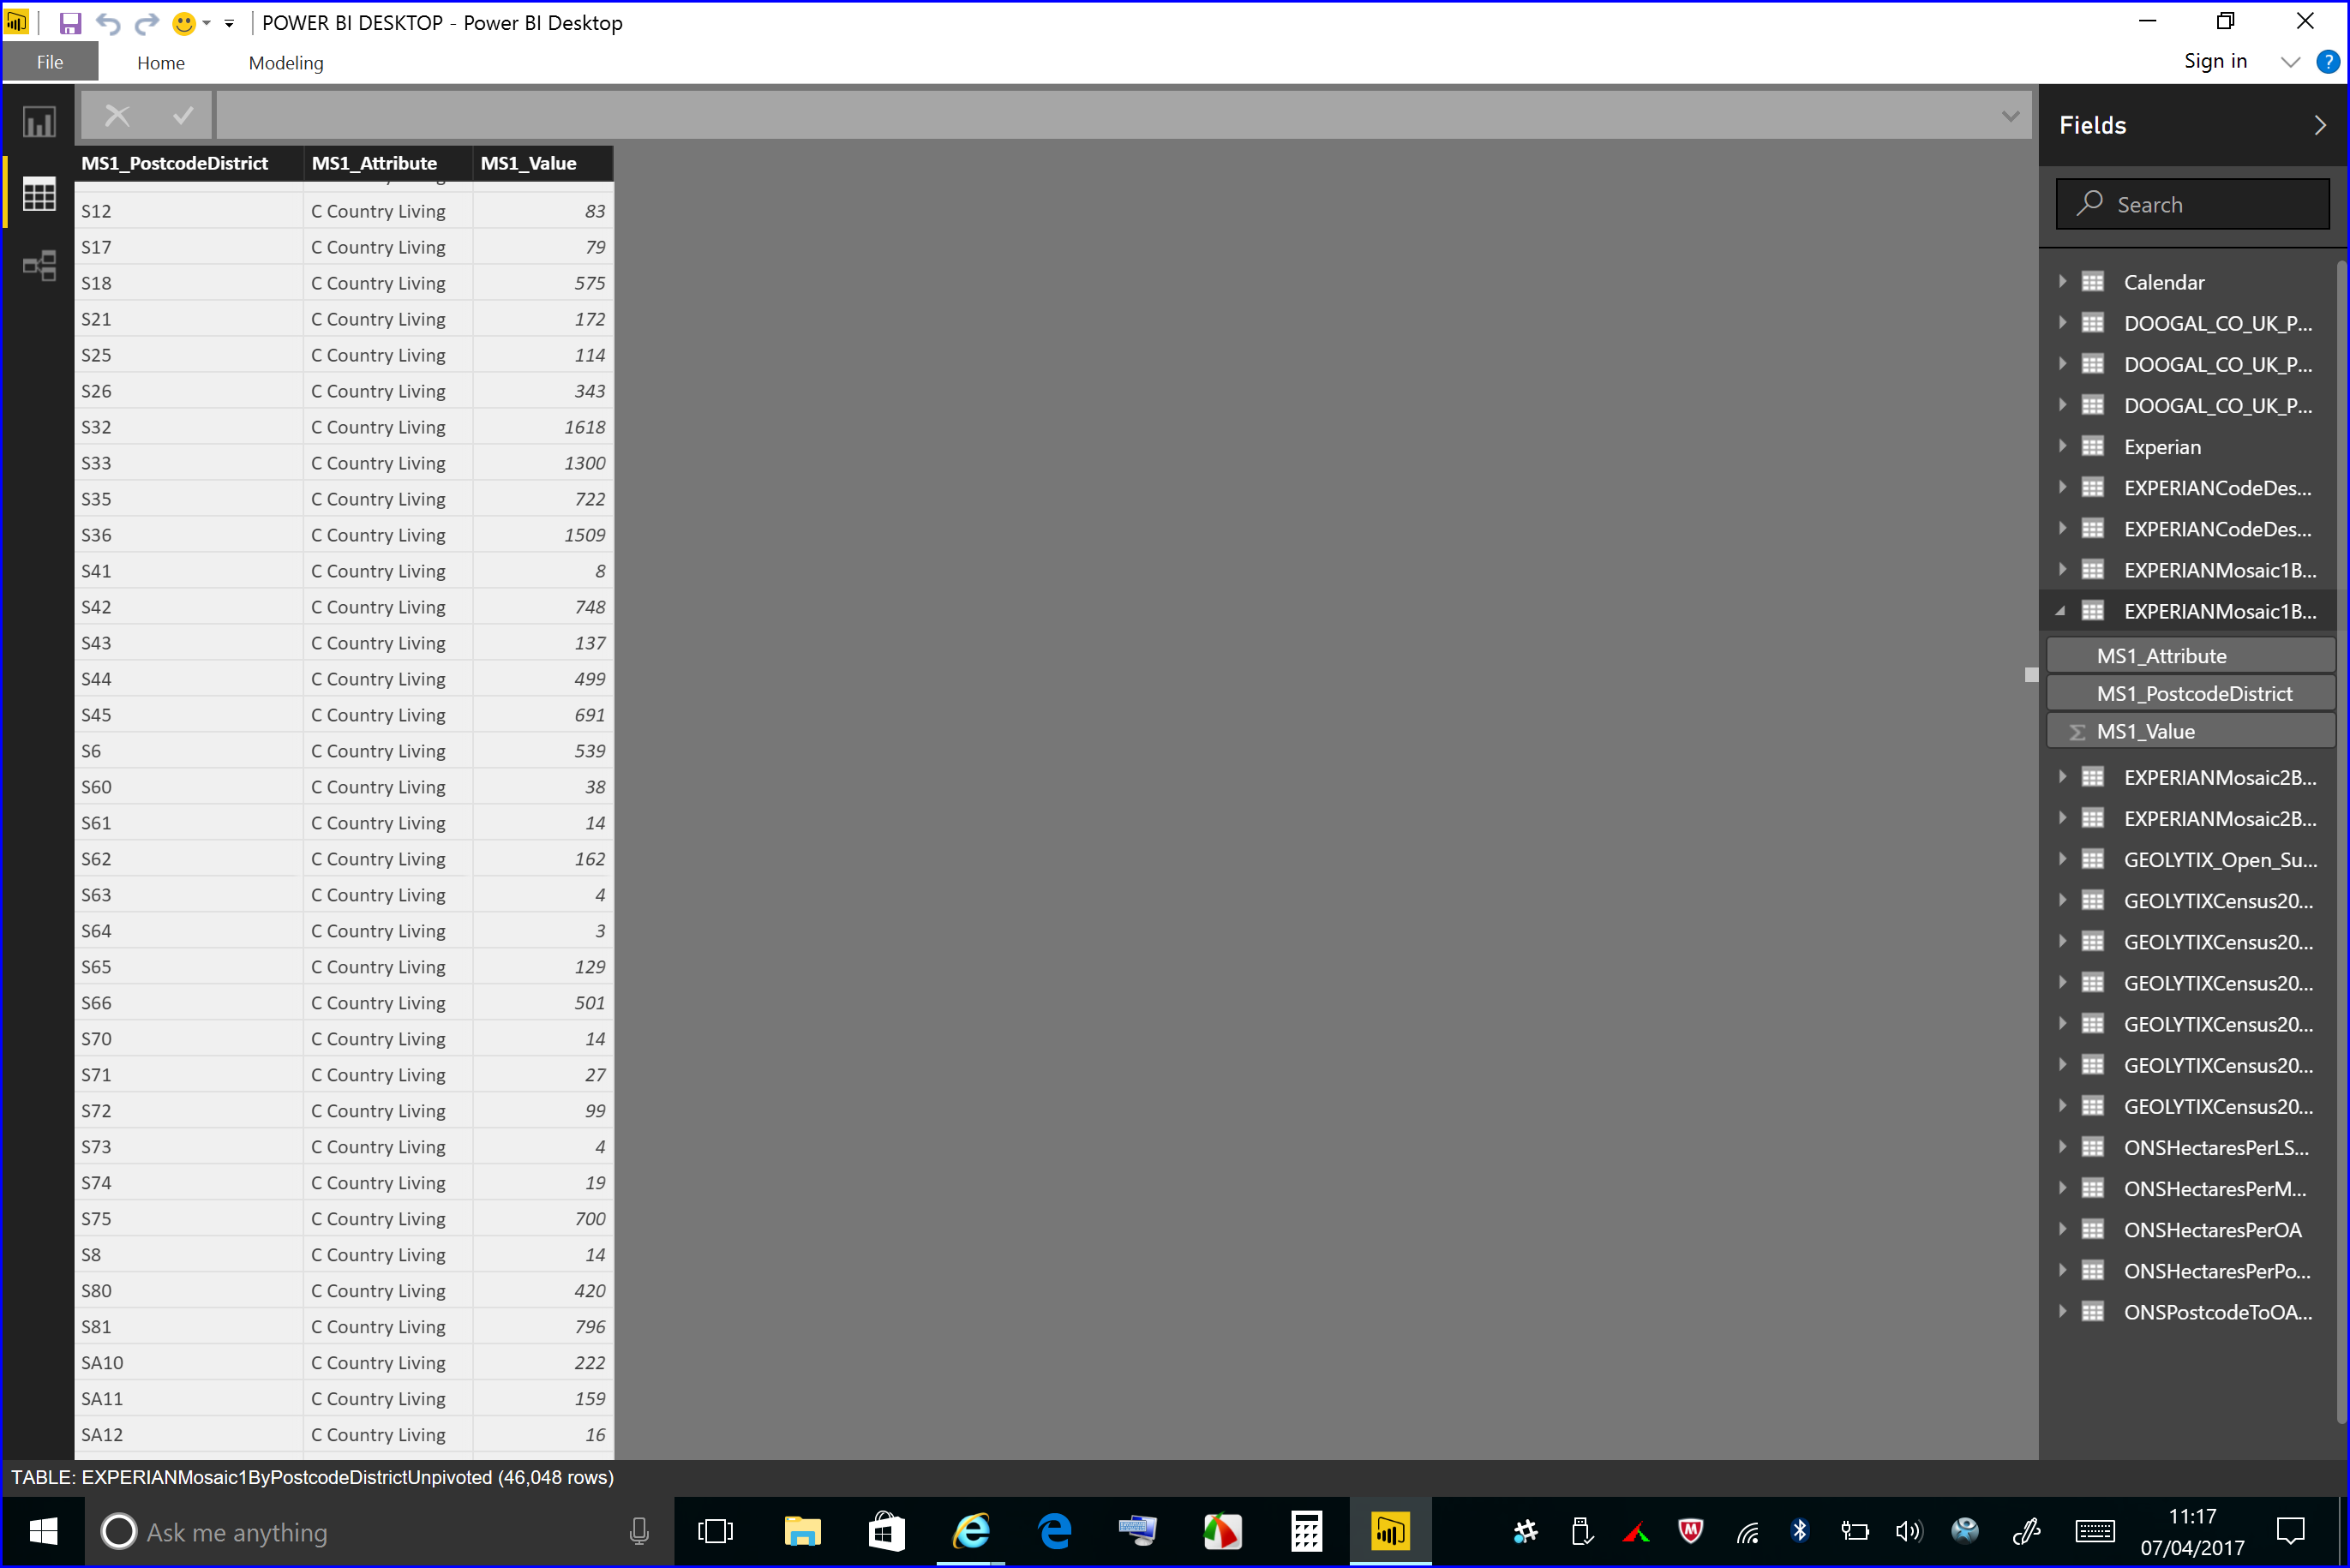
Image 8 This shows the Mosaic 1 data after it has been aggregated and transformed in Microsoft Access 2016 using a “CrossTab” query to the Postcode District code level and then “un-pivoted”.
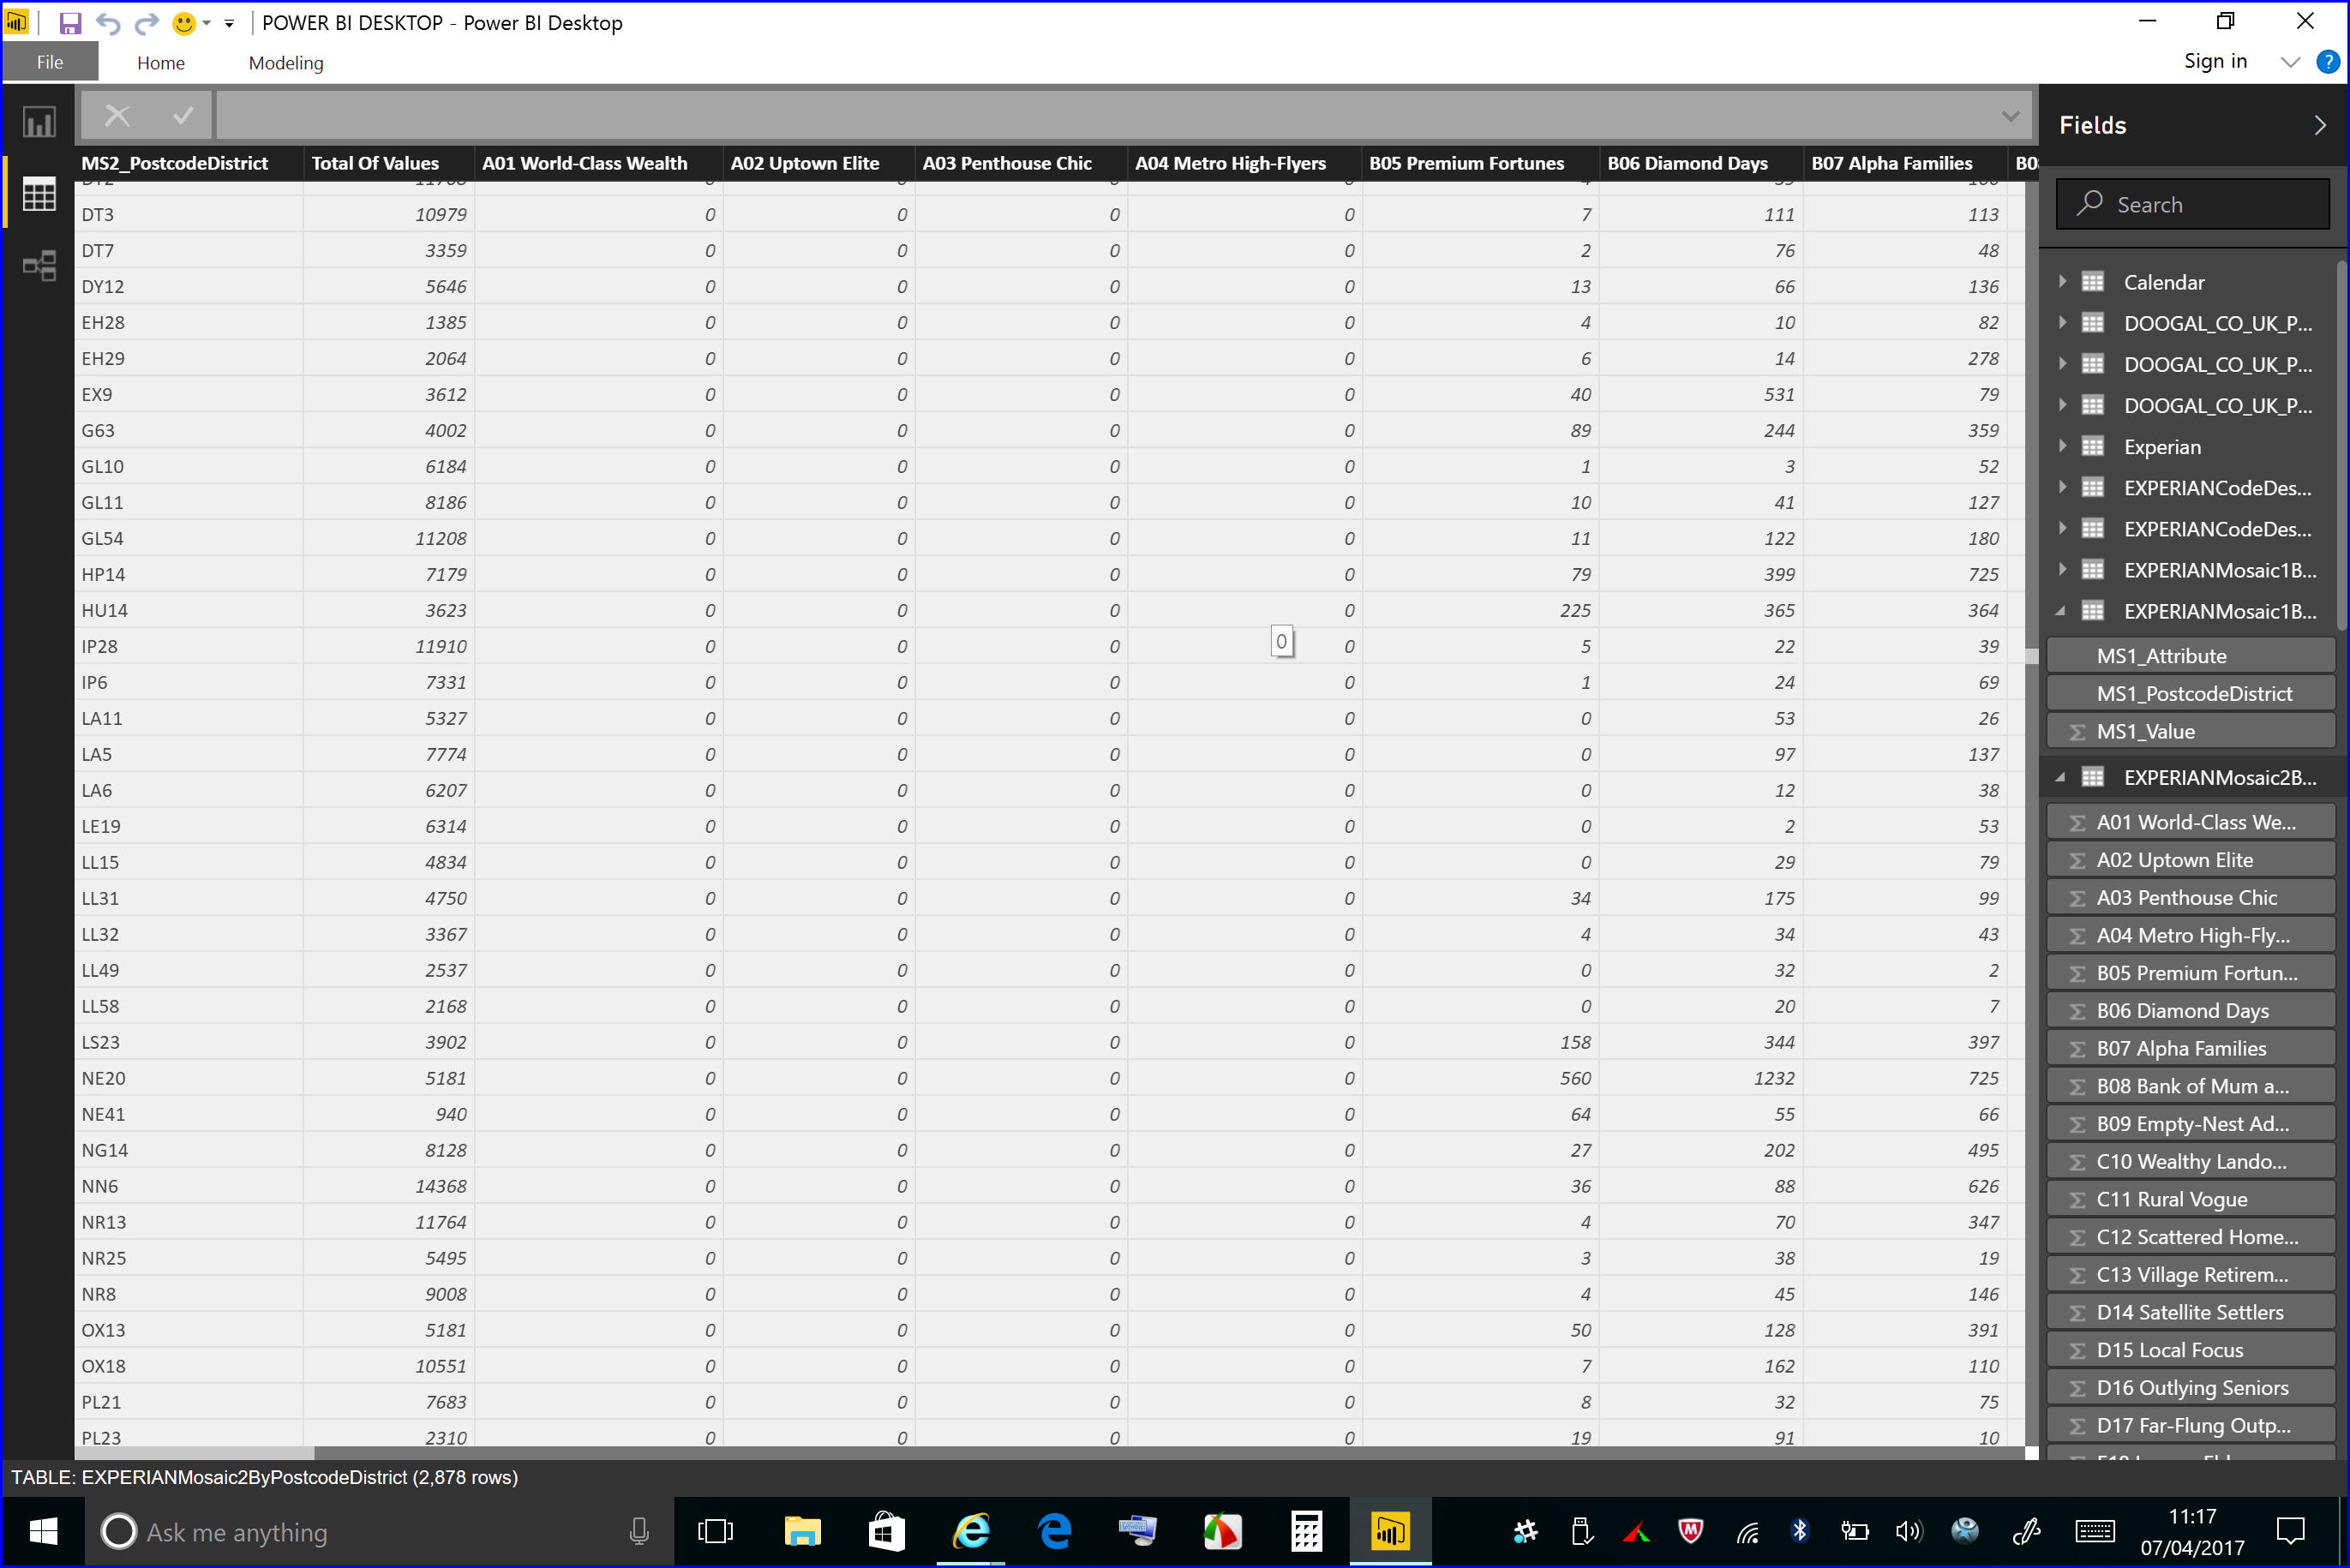
Image 9 This shows the Mosaic 2 data after it has been aggregated and transformed in Microsoft Access 2016 using a “CrossTab” query to the Postcode District code level.
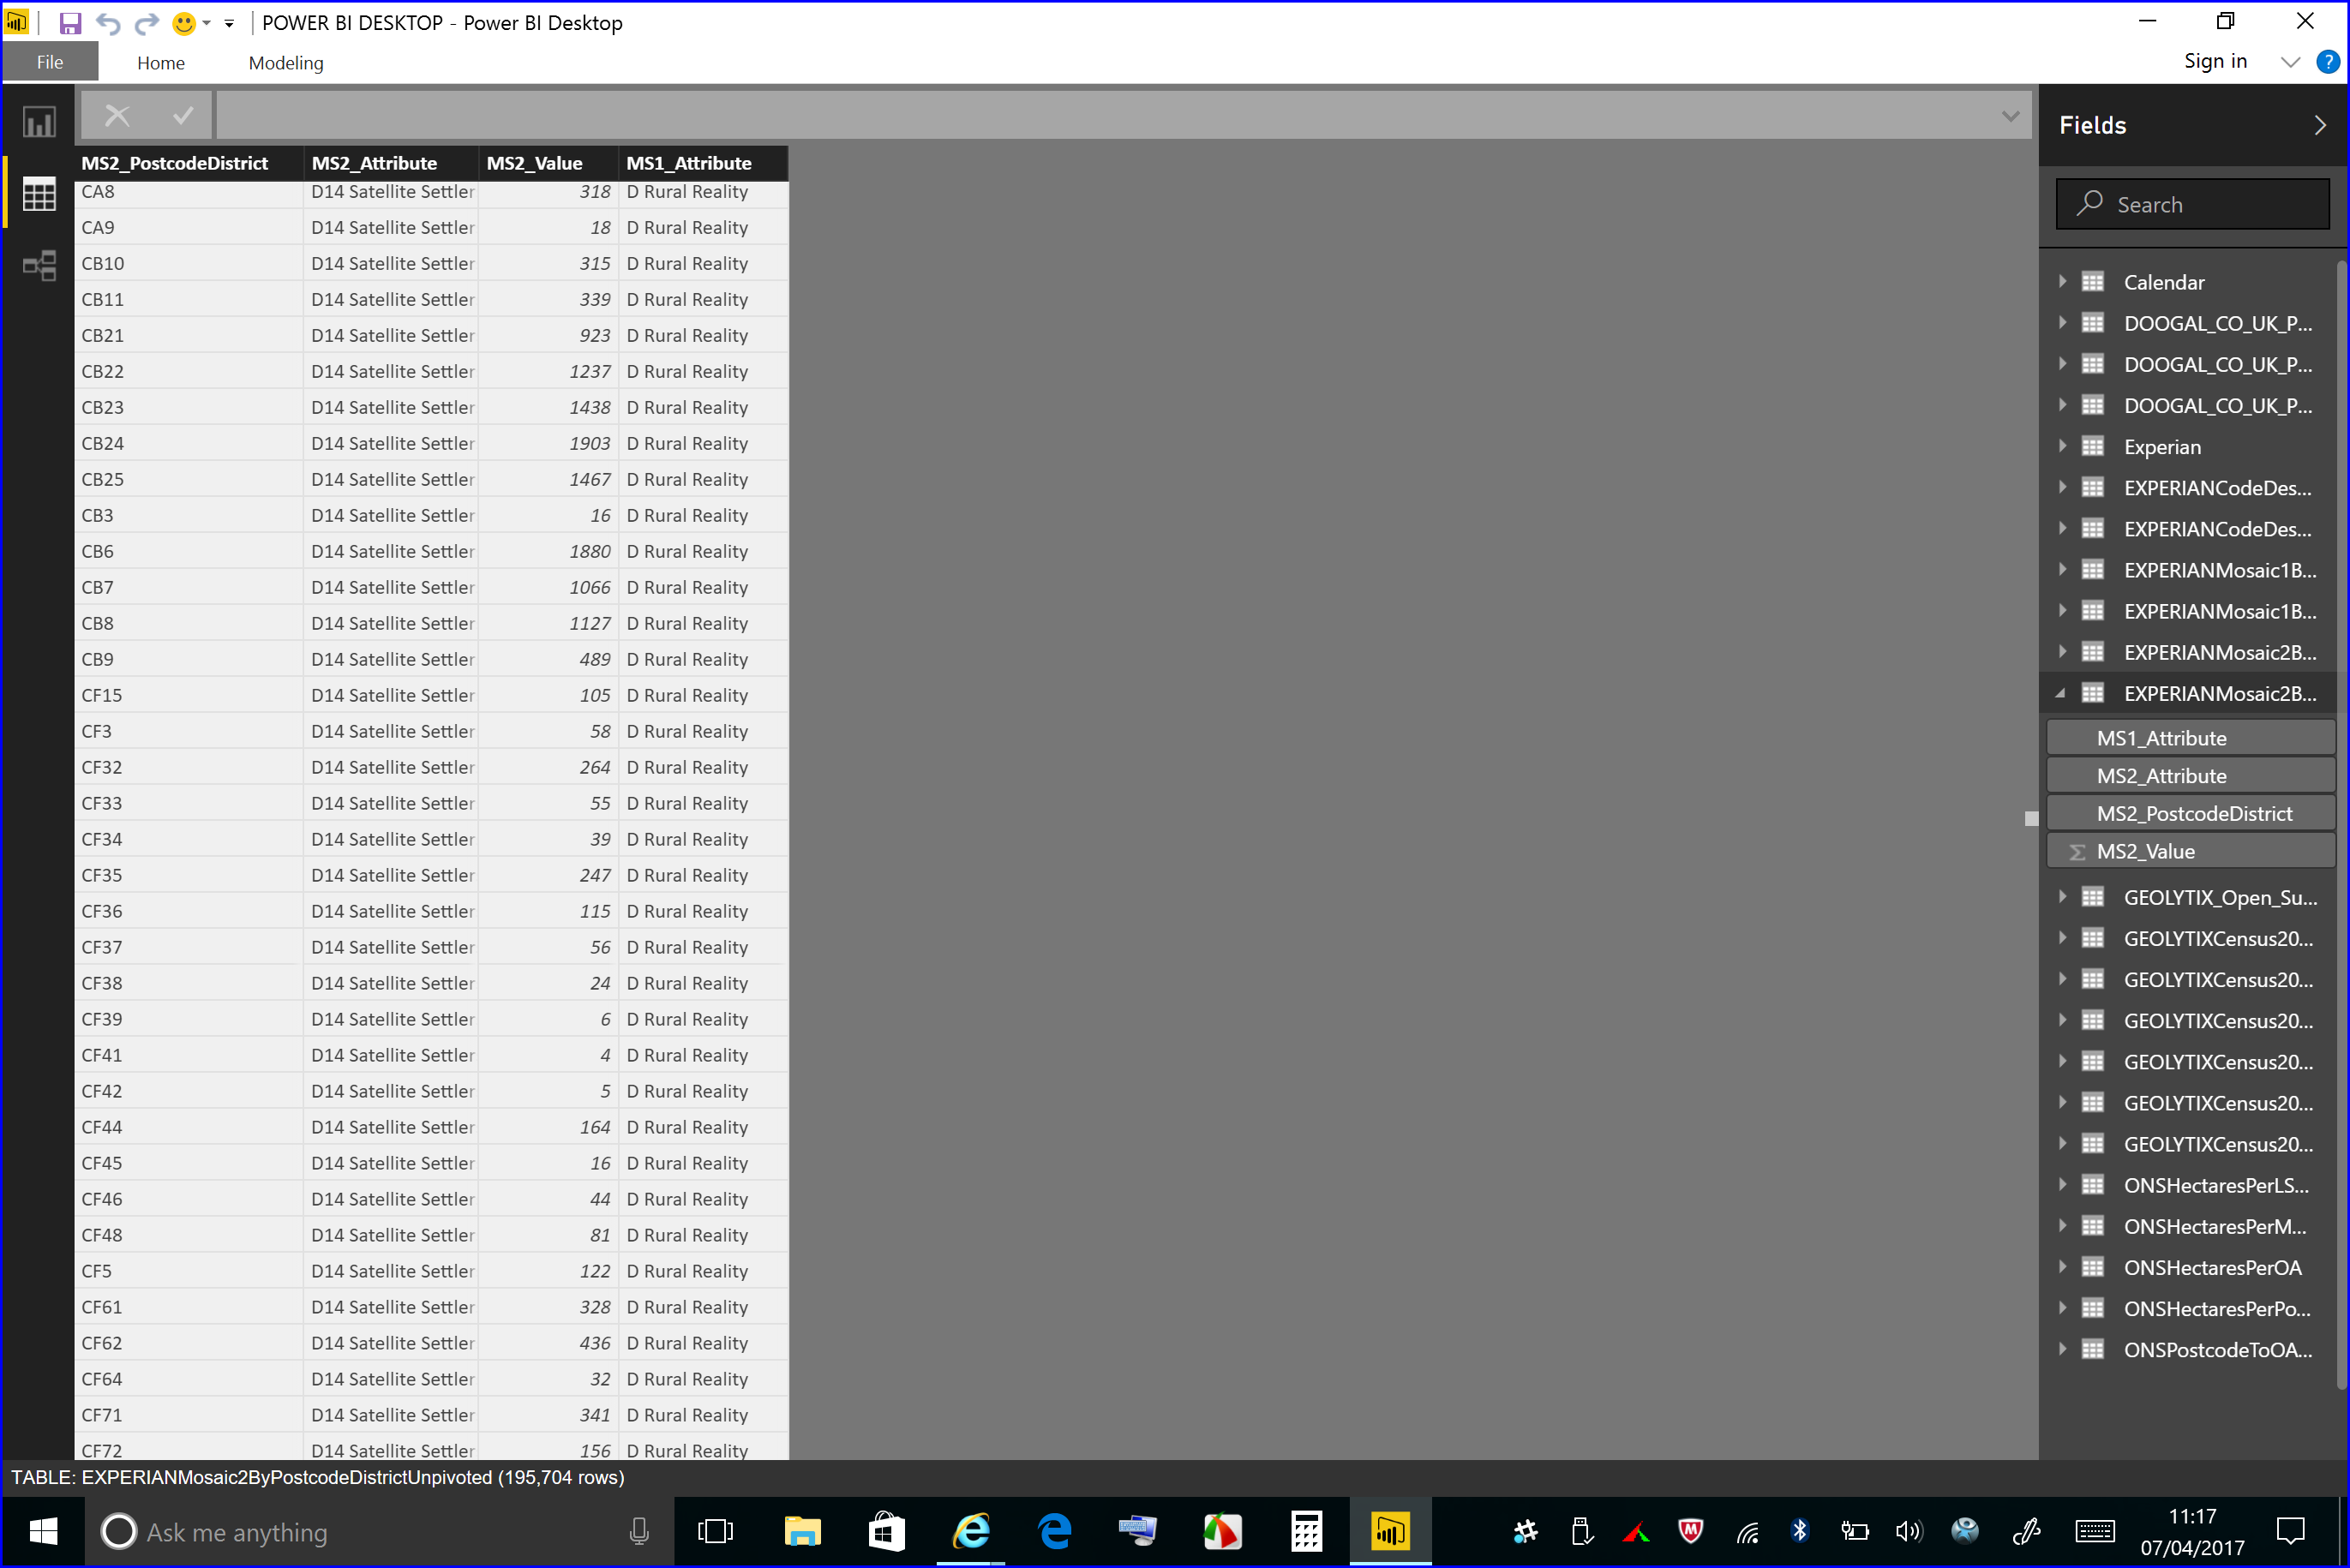
Image 10 This shows the Mosaic 1 data after it has been aggregated and transformed in Microsoft Access 2016 using a “CrossTab” query to the Postcode District code level and then “un-pivoted”.
Here’s hoping that this was of interest. If you have any questions feel free to contact me at fred.williams@insightfuldatasolutions.com