Power BI – Mapping when “Disconnected”
Having recently read an article on the subject (Aaron Bator MSFT, Click here for his blog entry) I decided to share my own similar approach to providing “geographical” visualisations in a report.
I am a member of a team working on the creation of a Neighbourhood Plan for the Parish, Tilehurst, in which I live. As part of my input to the plan I have been investigating how to visualise all manner of demographic data (from the Office for National Statistics) on standard and custom maps.
I, like Aaron, looked at the current options in Power BI Desktop and found none of them to be what I was looking for. The need to be connected to the Internet was one issue as was the lack of any serious capability to use my own “custom regions”.
Being a big fan of the “Synoptic Panel” Power BI Desktop visualisation and it’s sister the “Synoptic Designer” website (both by OKViz) I decided to create the custom maps that I needed as follows:
1. GIS software (Mapviewer 8)
2. Export the created map as a “.png” file
3. Upload the “.png” to the “Synoptic Designer website“
4. Define the areas and then export the results as a “.svg” file
5. Add the “.svg” file(s) to a Report using the “Synoptic Panel” visualisation
6. Link the visualisation(s) to the data table
Office for National Statistics (ONS) Population Report for Tilehurst Parish
Click HERE to view the interactive reports in a new browser tab.
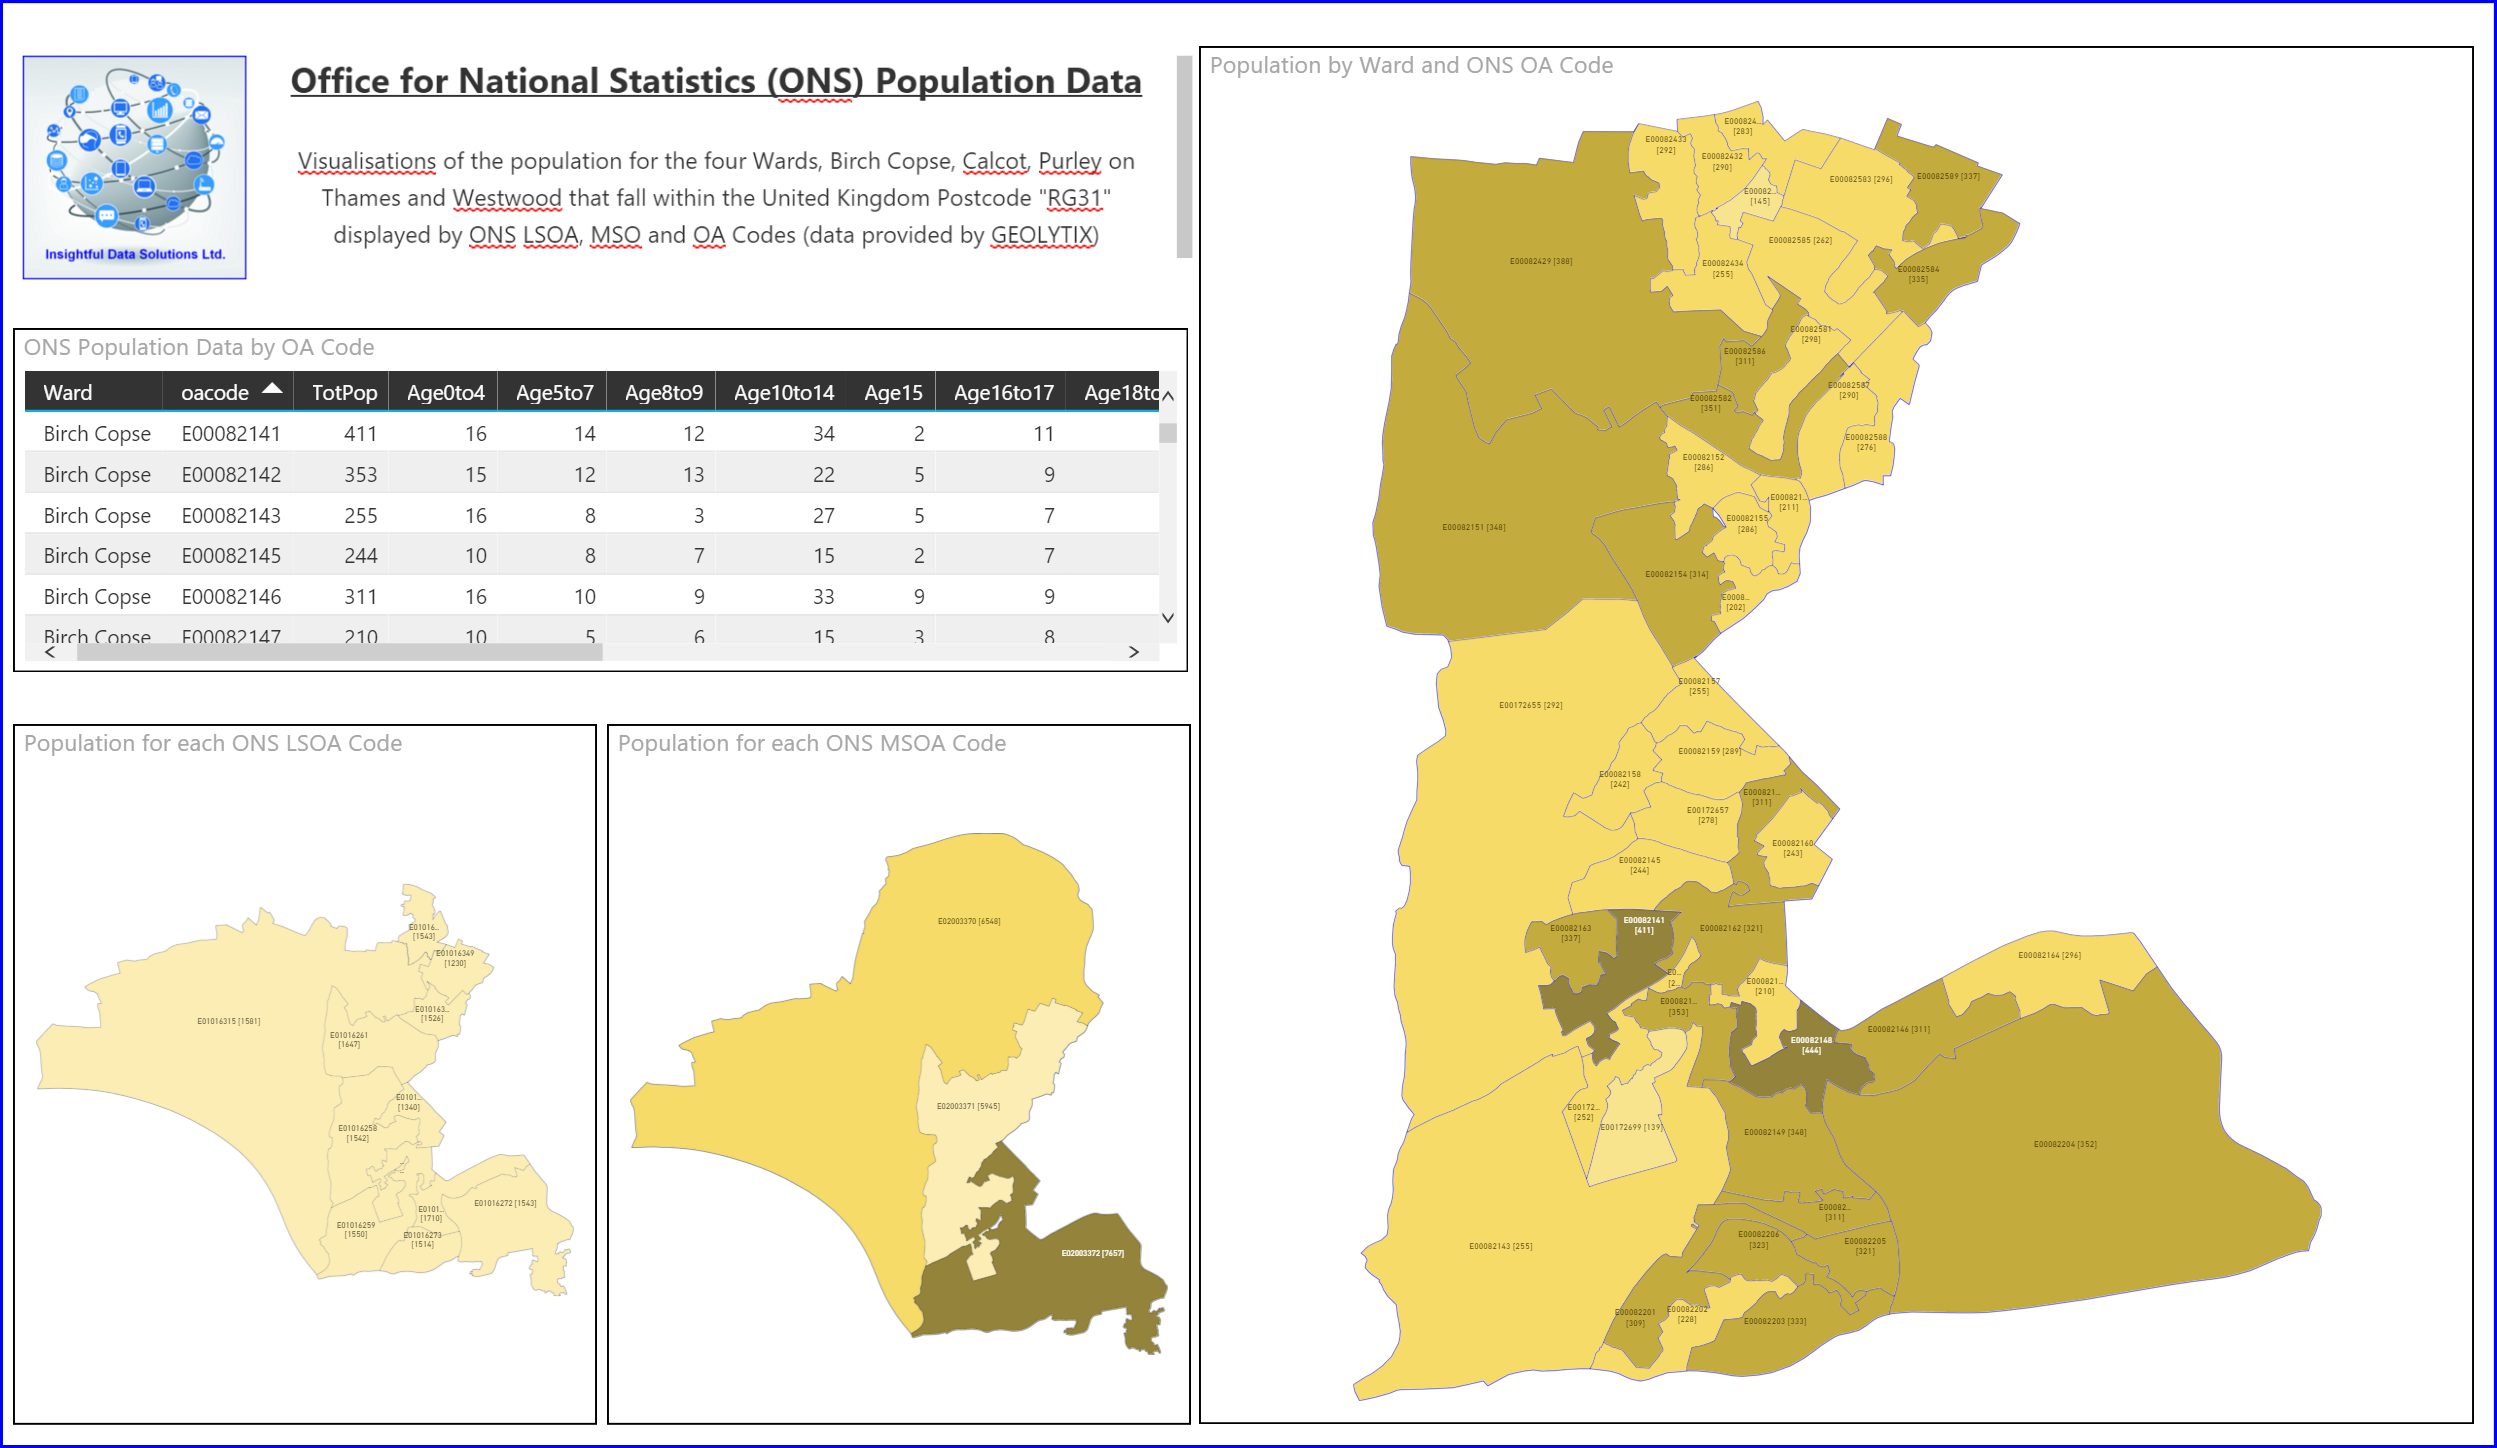 Image 1: Tilehurst Parish population by ONS Lower Layer Super Output Area (LSOA), Middle Layer Super Output Area (MSOA) and Output Area (OA).
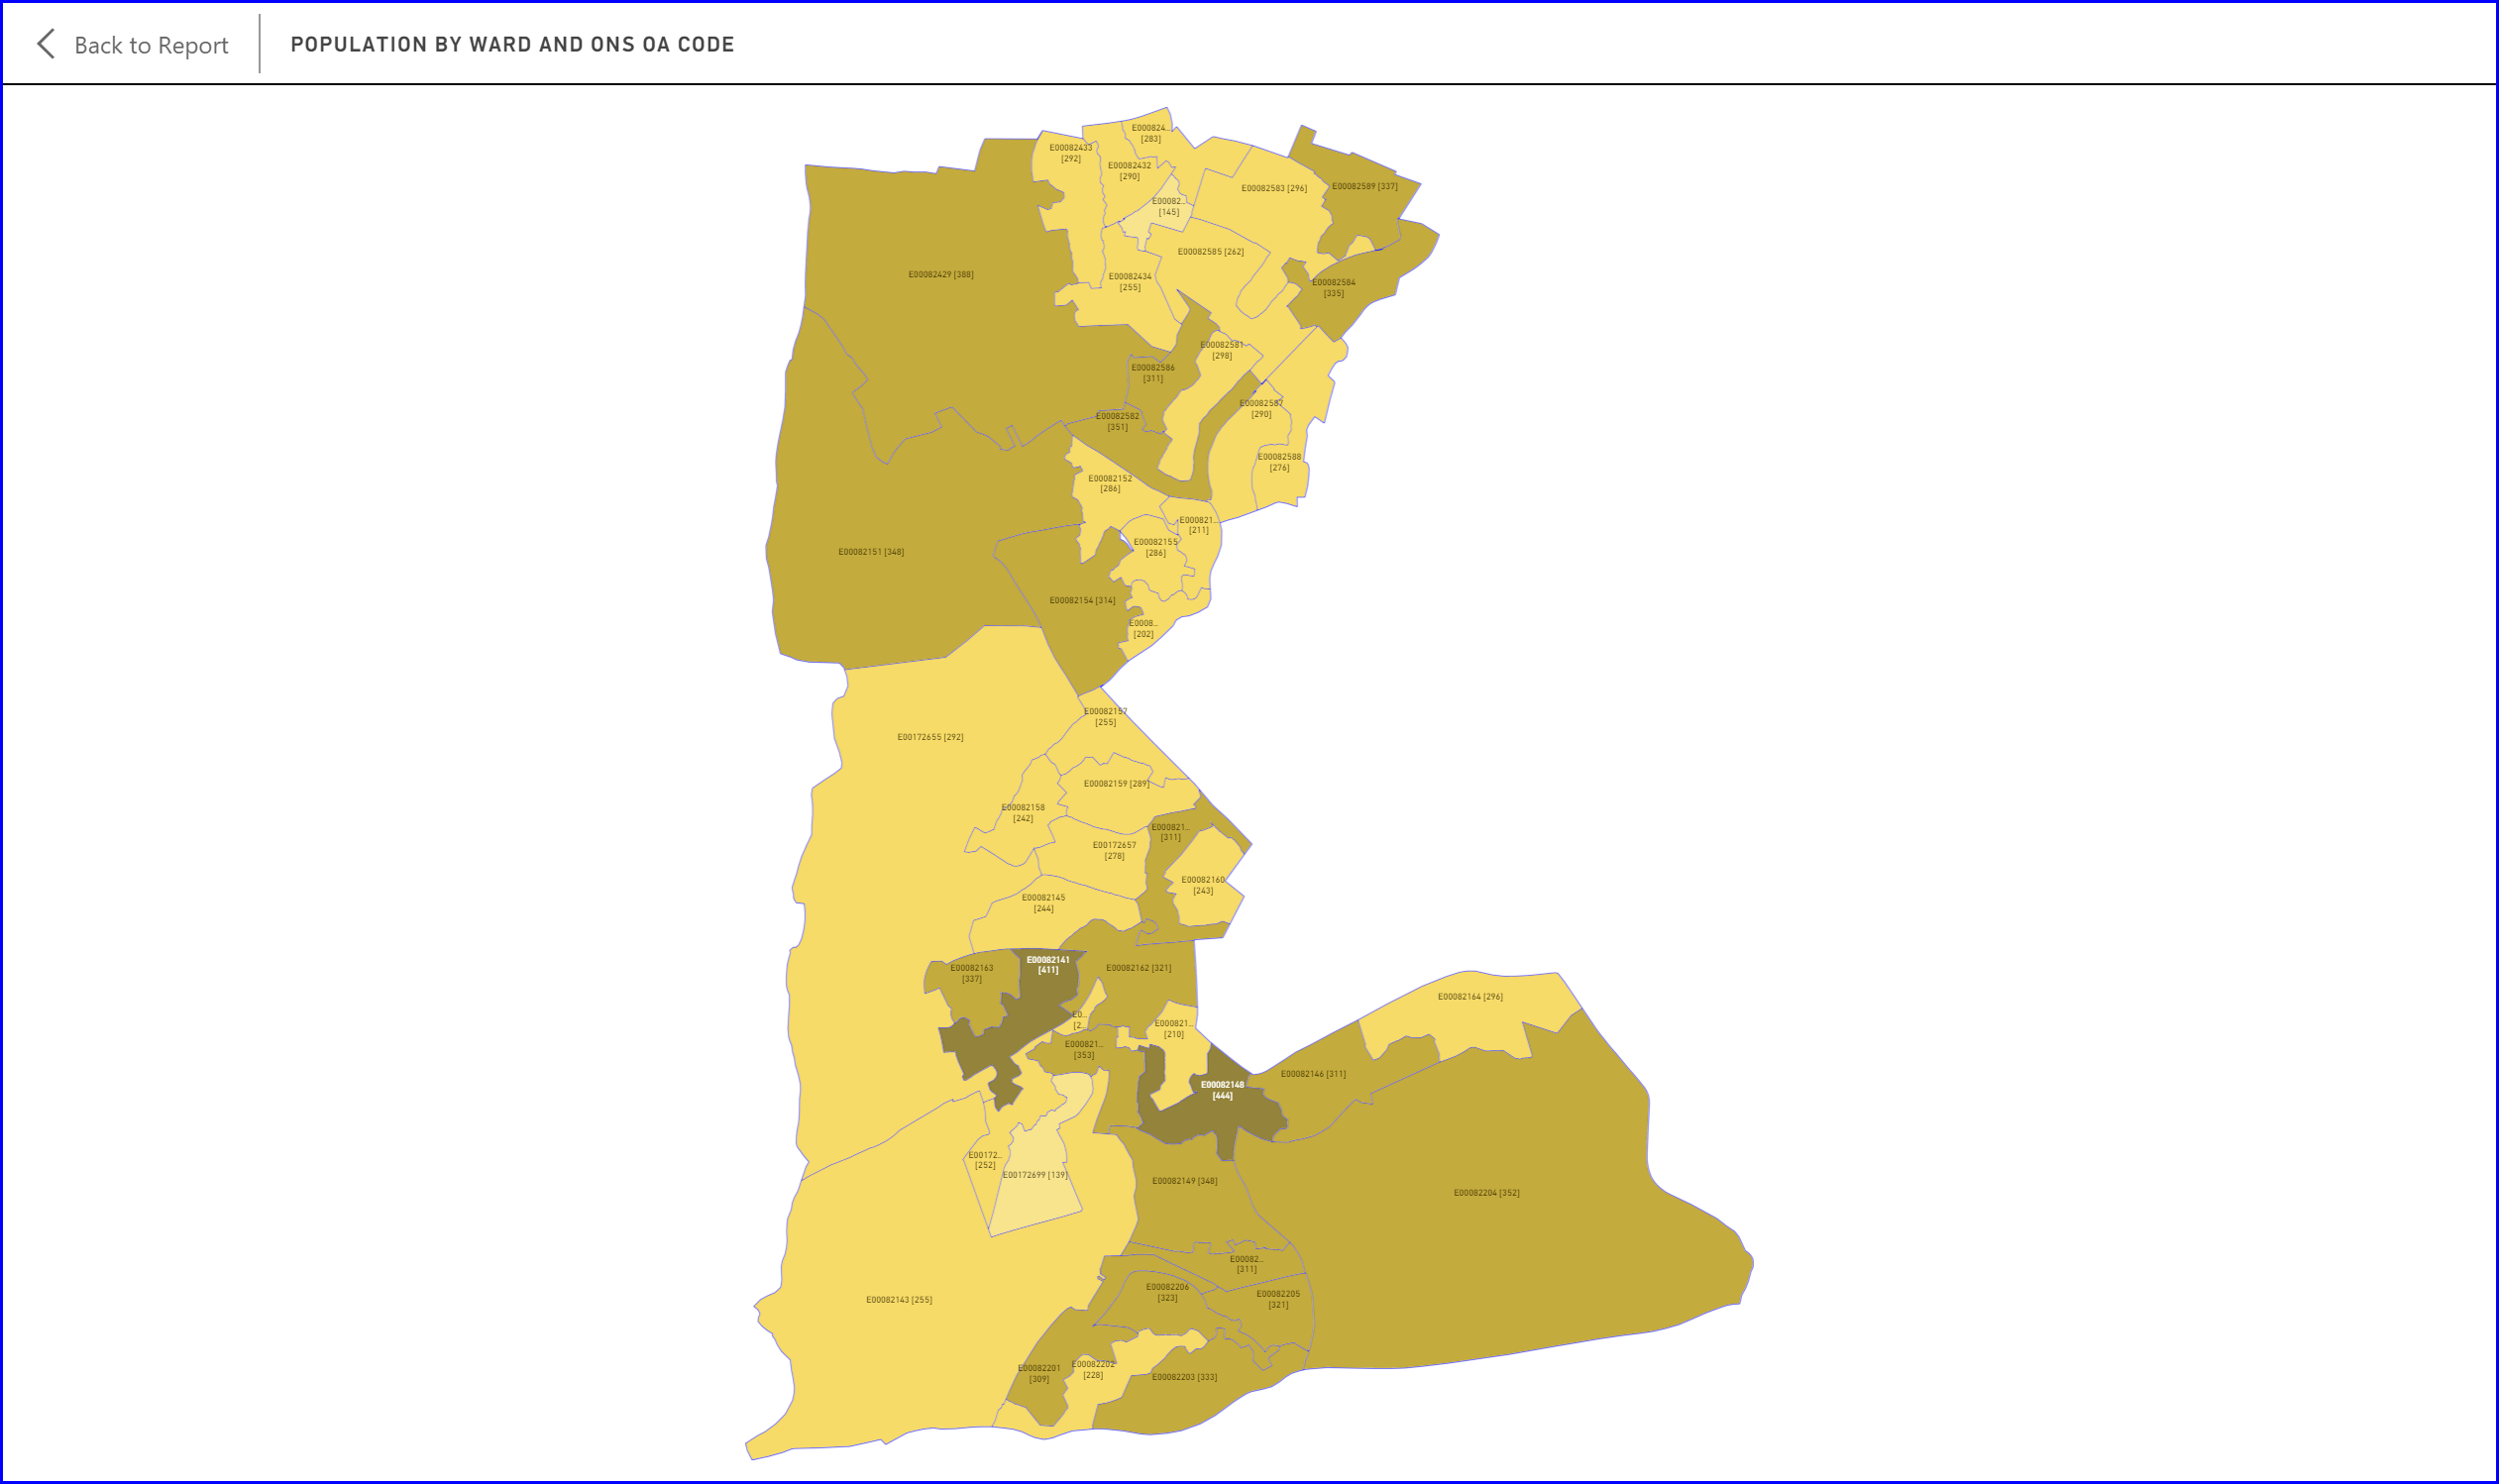
Image 2: Map showing the population of Tilehurst Parish by Ward and Output Area (OA)
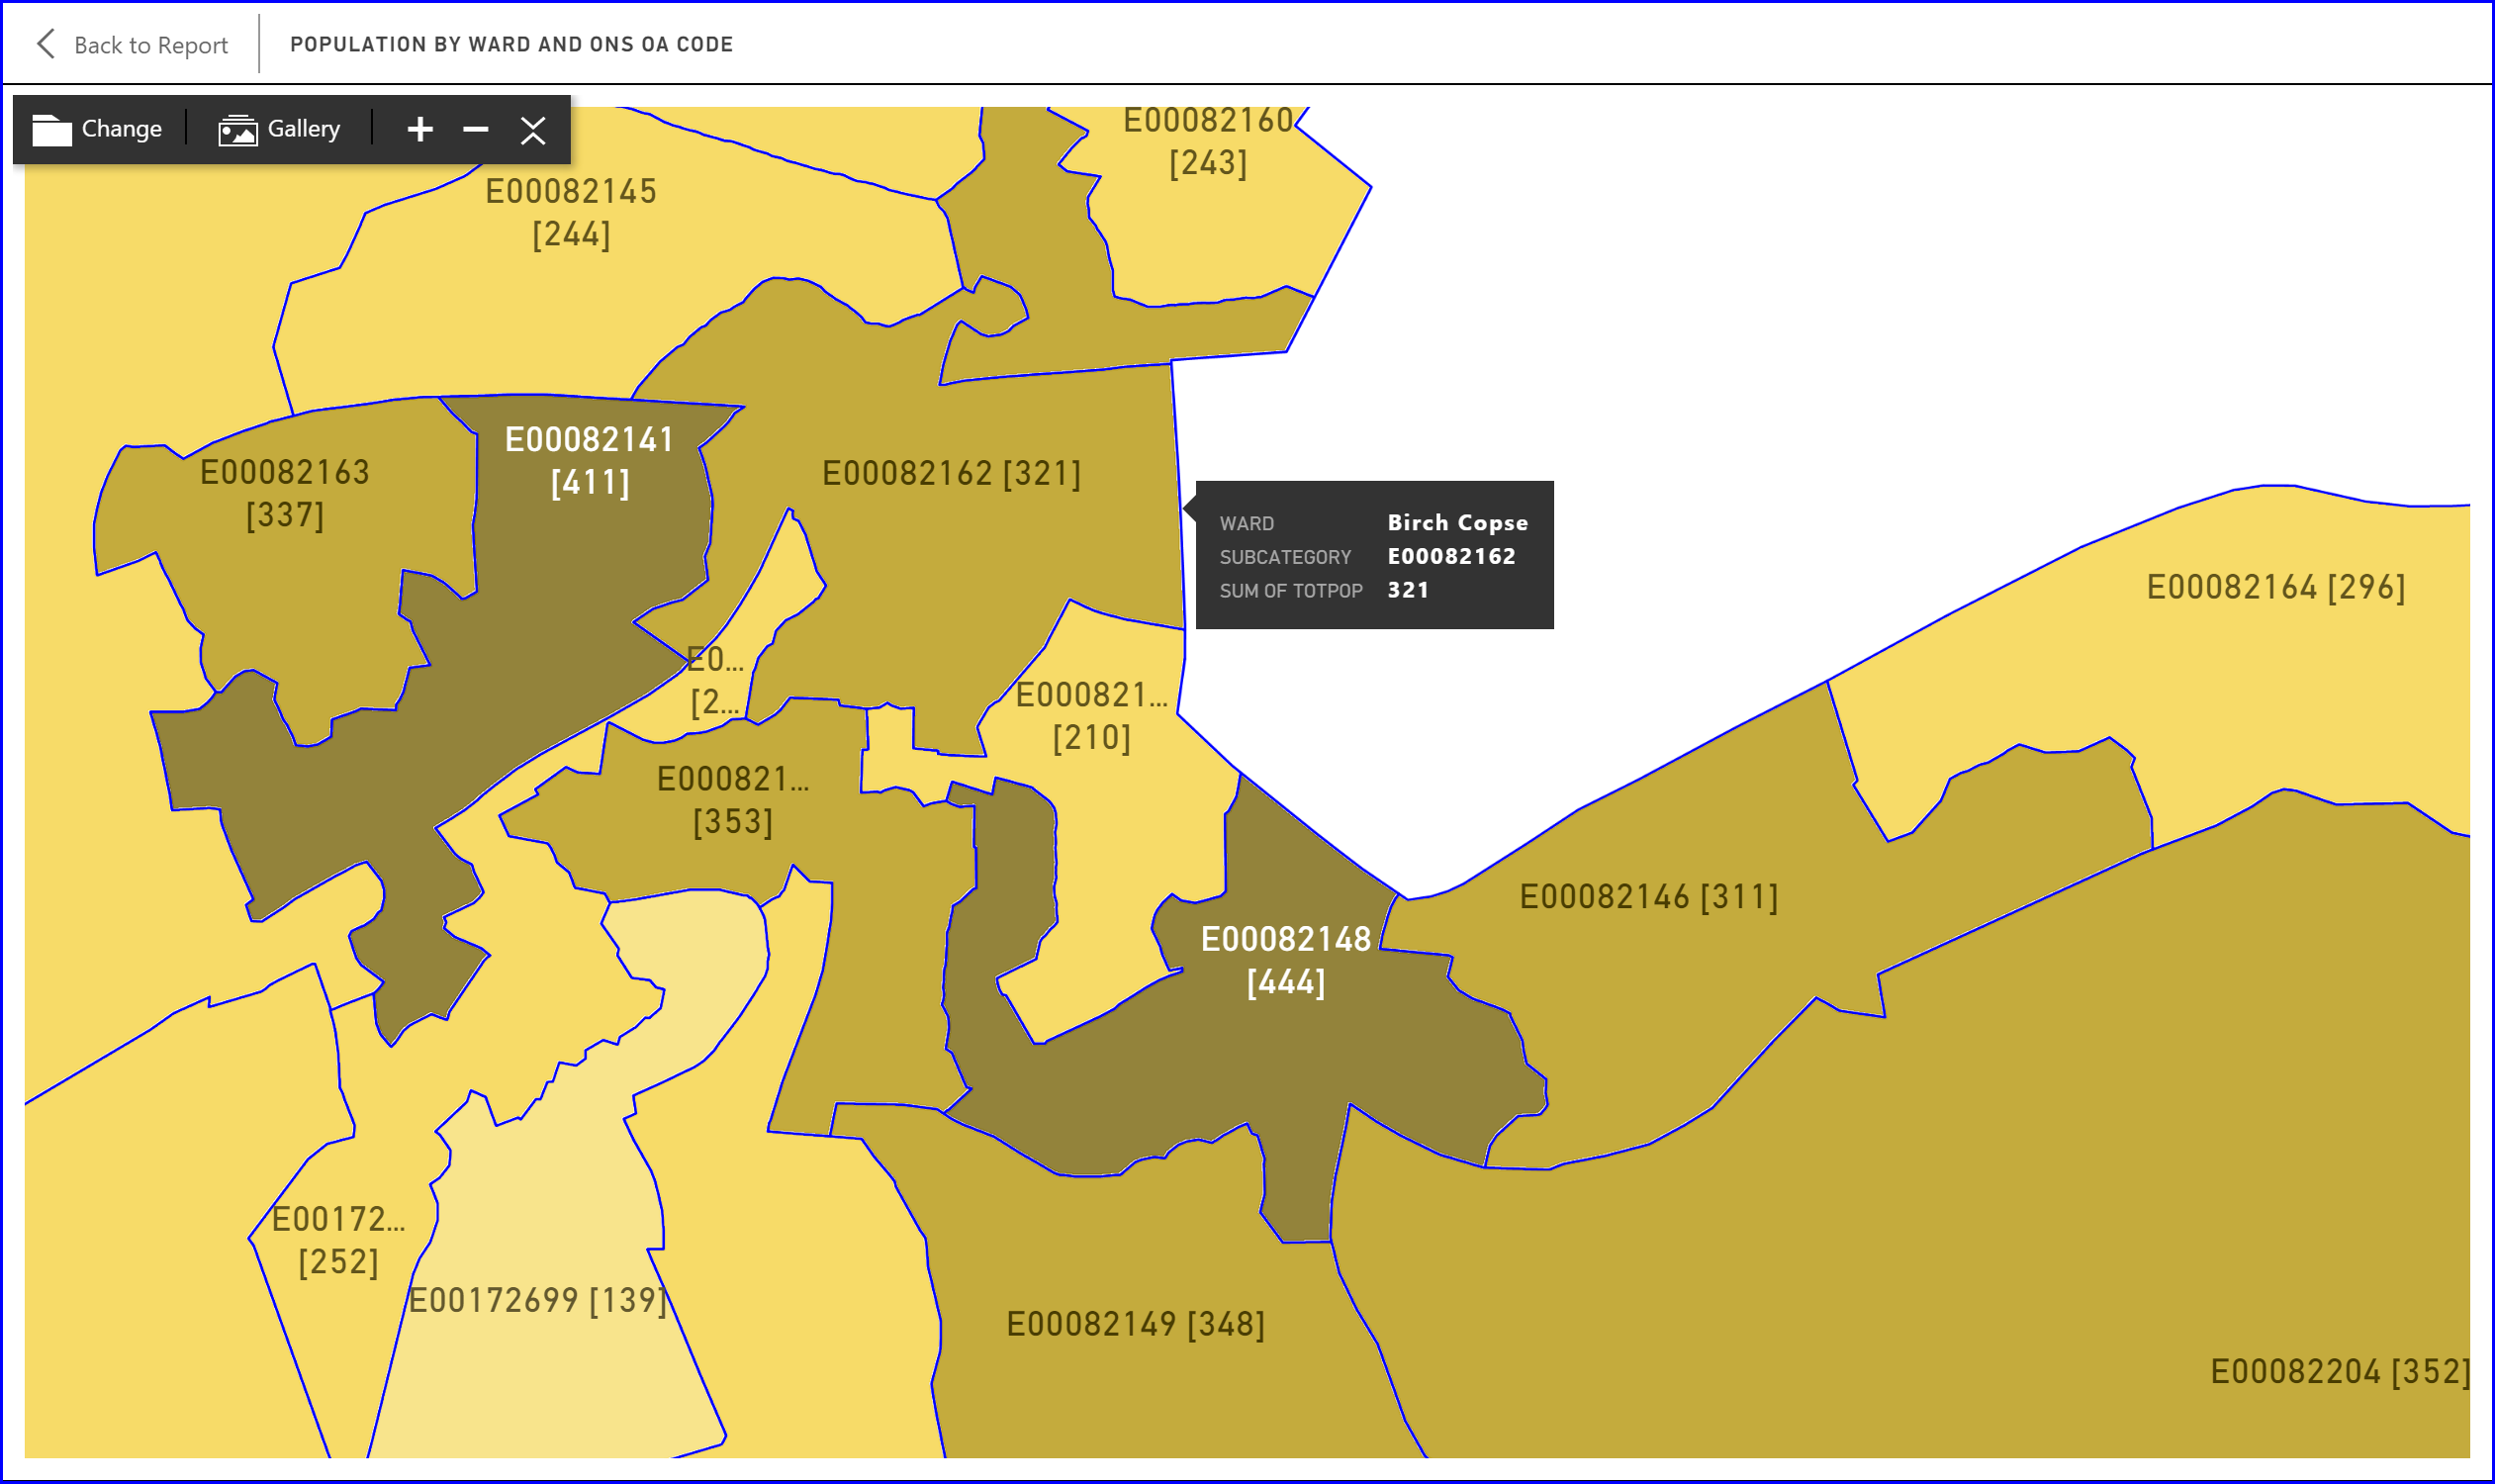
Image 3: Zooming in to map showing the population of Tilehurst Parish by Ward and Output Area (OA). Note the use of the “States” settings to colour the Output Areas by population.
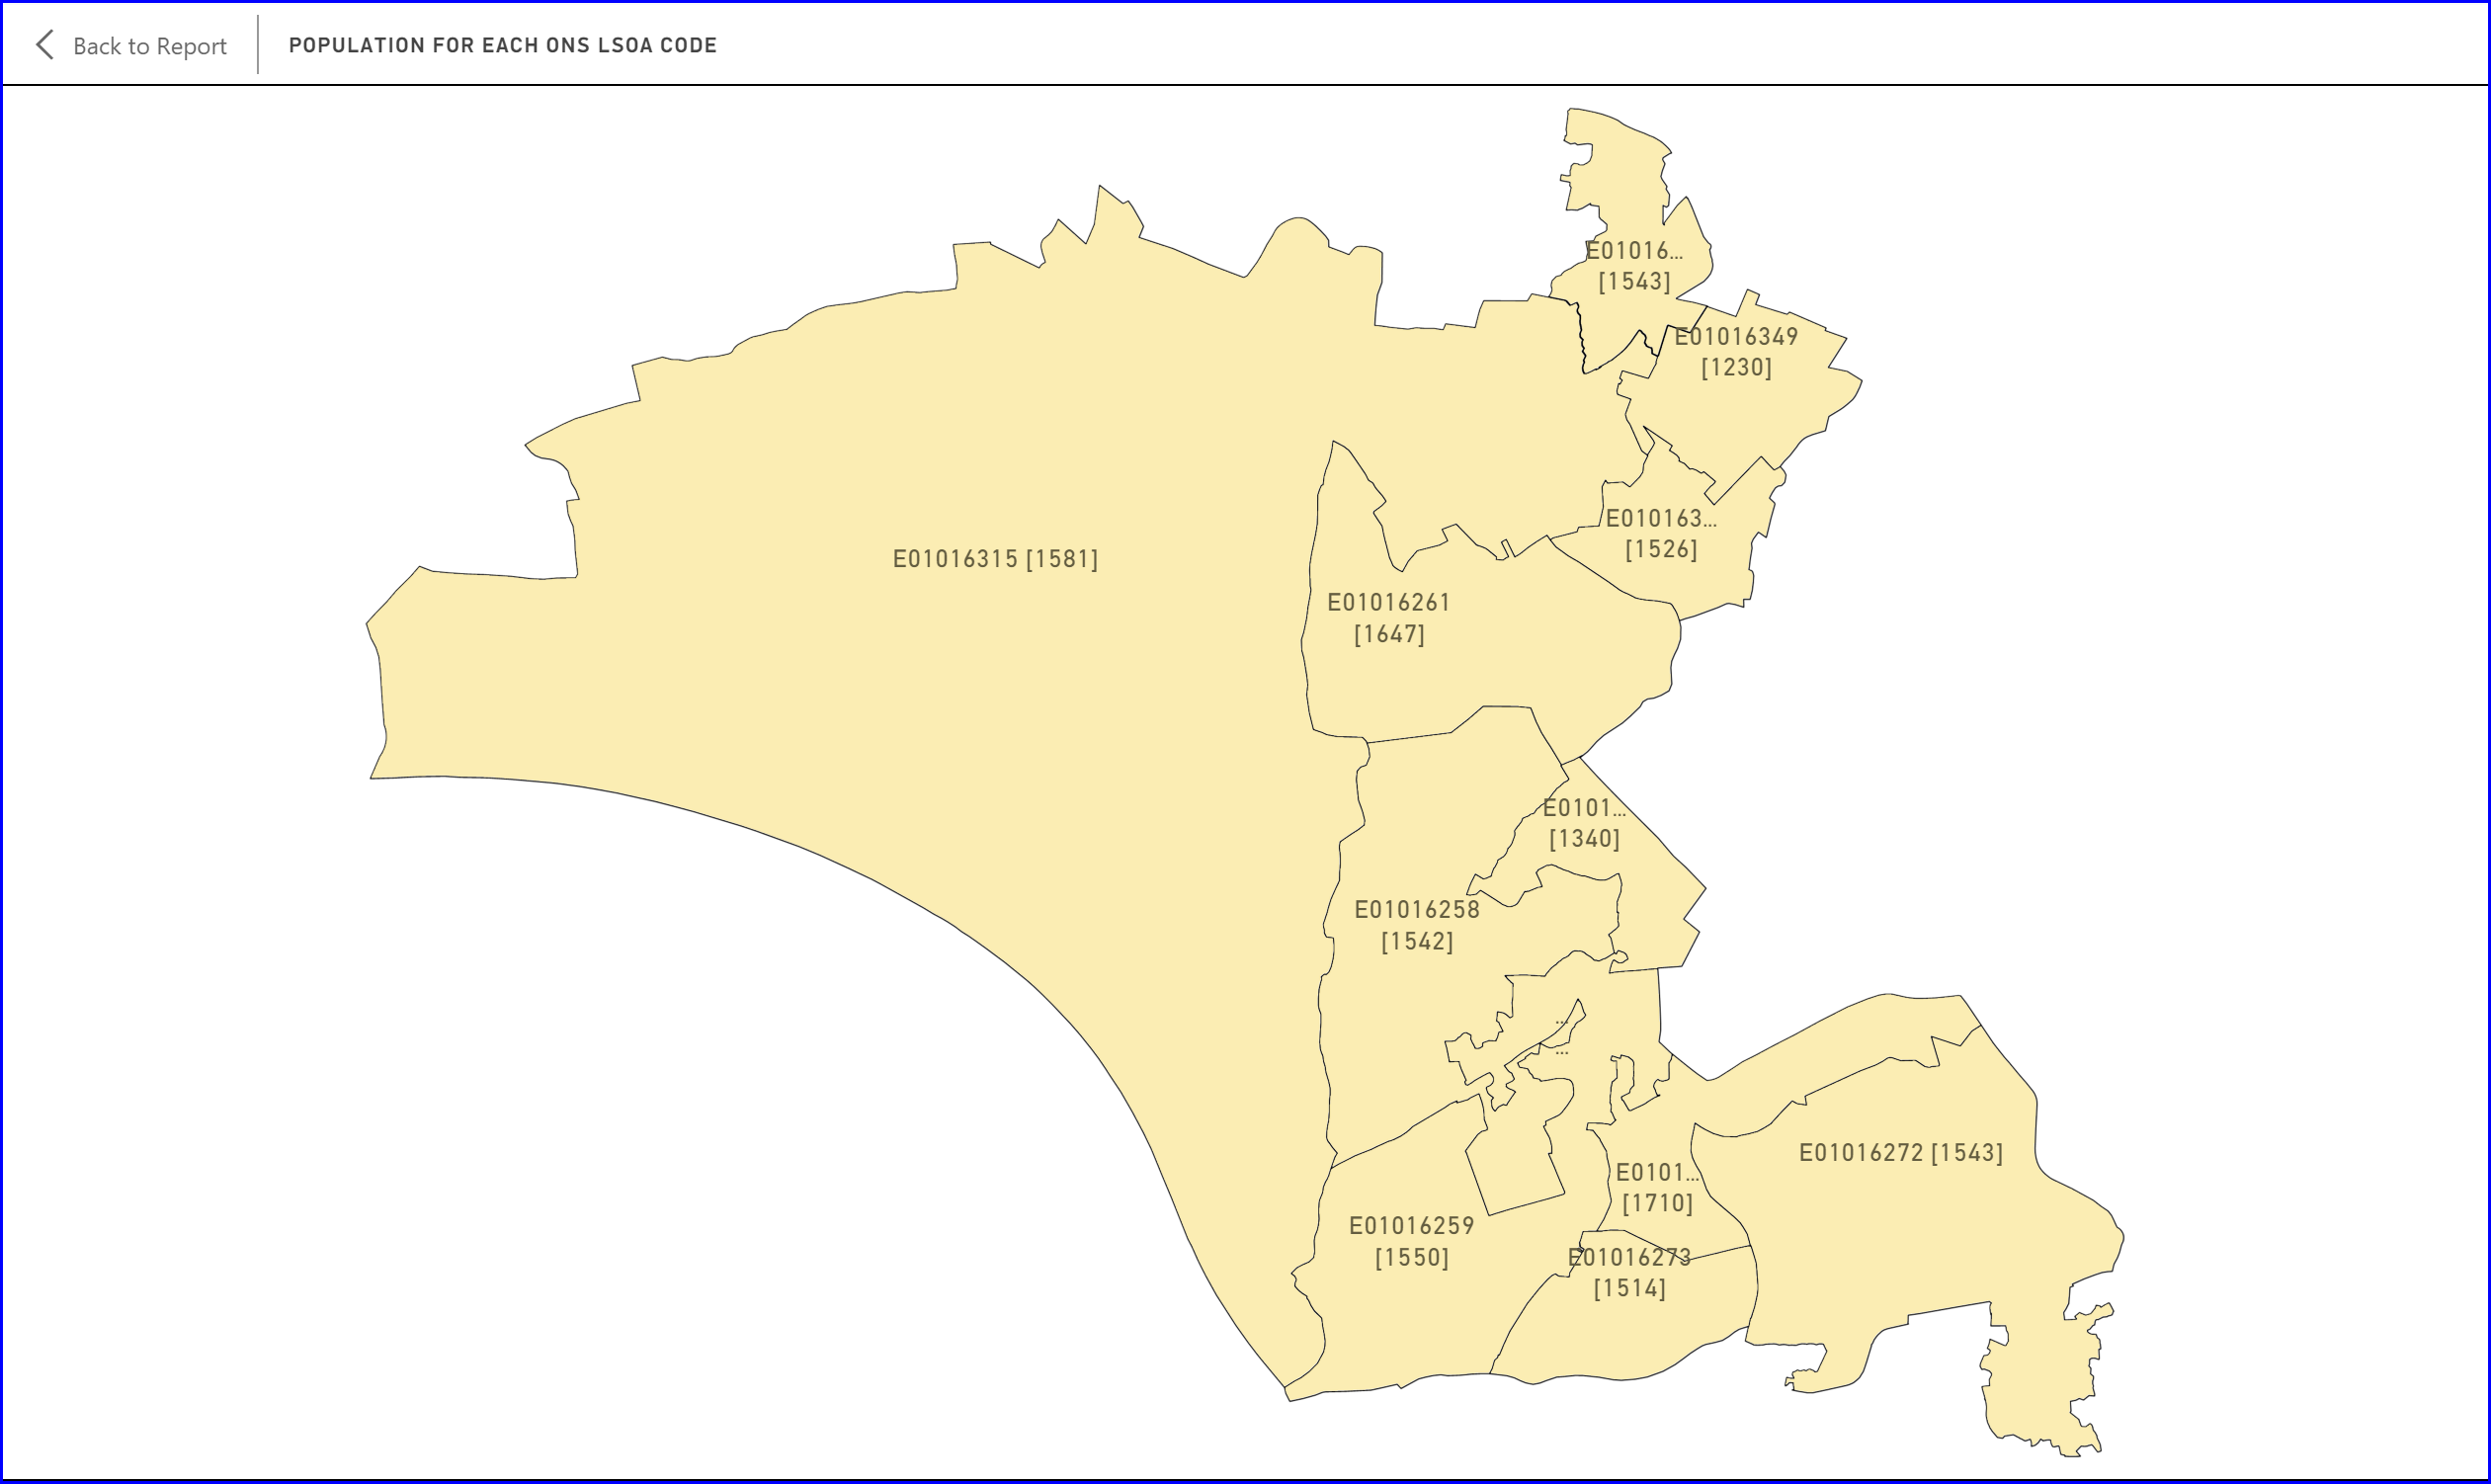
Image 4: Map showing the population of Tilehurst Parish by Middle Layer Super Output Area (MSOA)
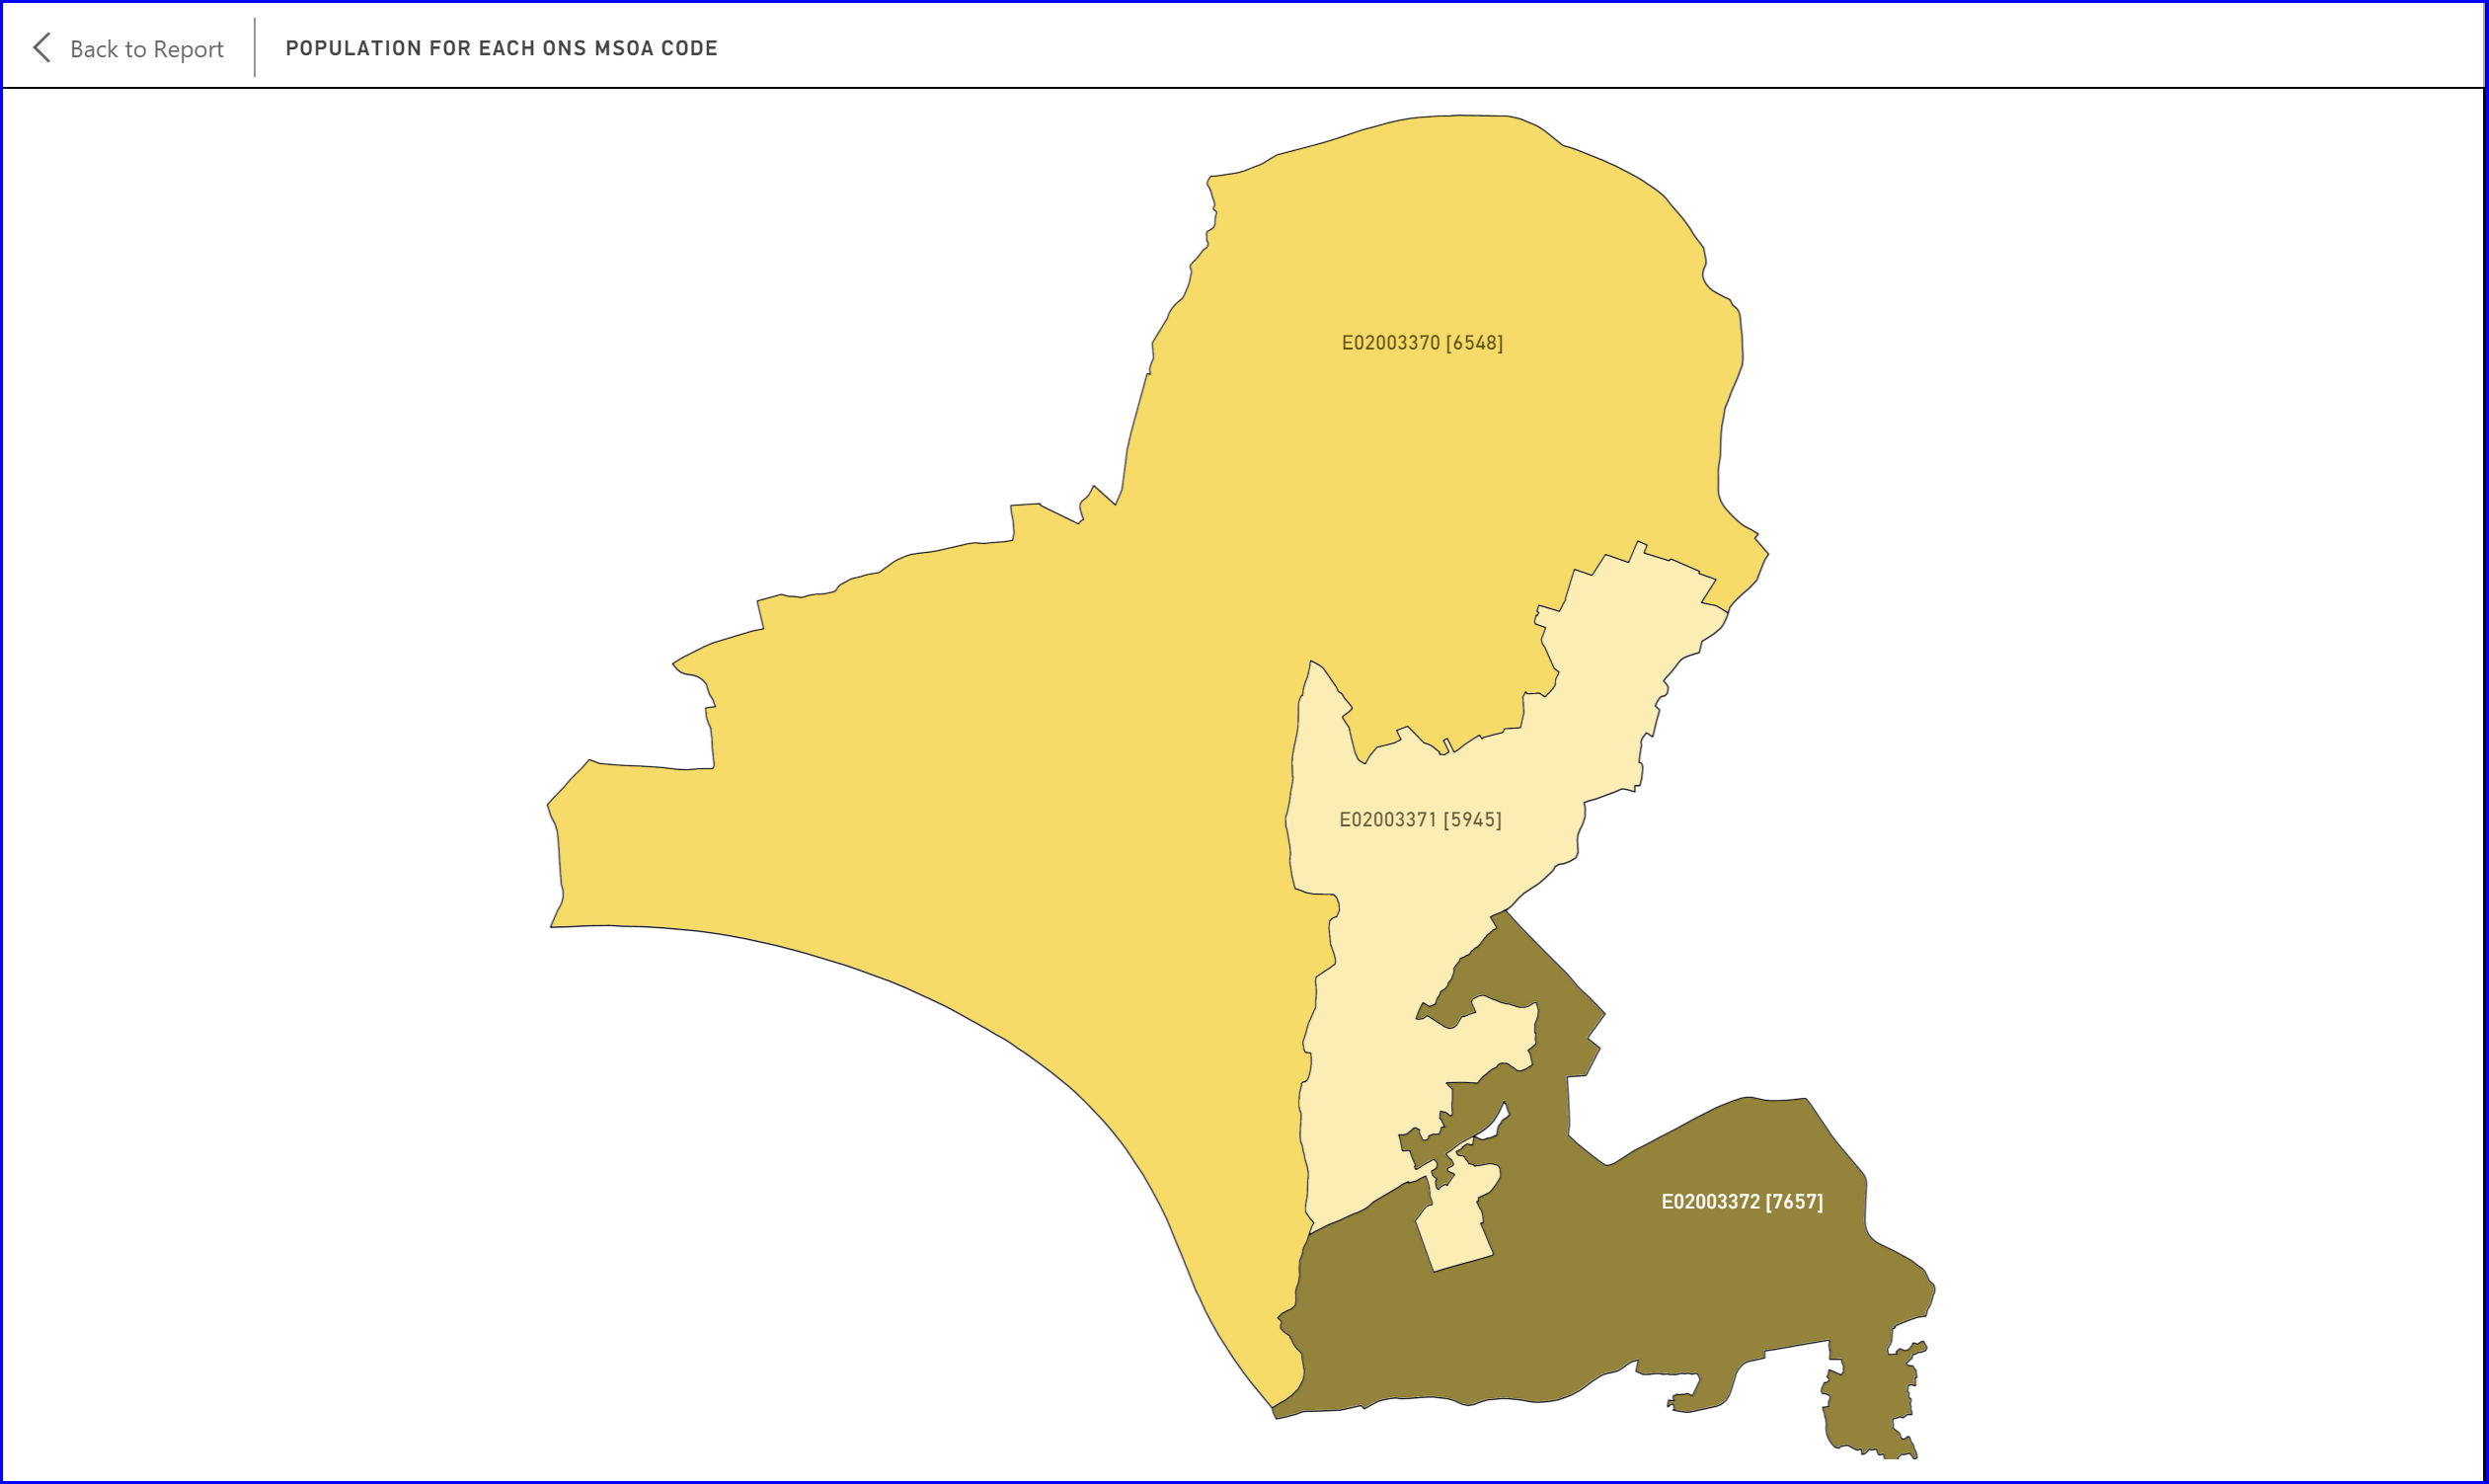
Image 5: Map showing the population of Tilehurst Parish by Lower Layer Super Output Area (LSOA)
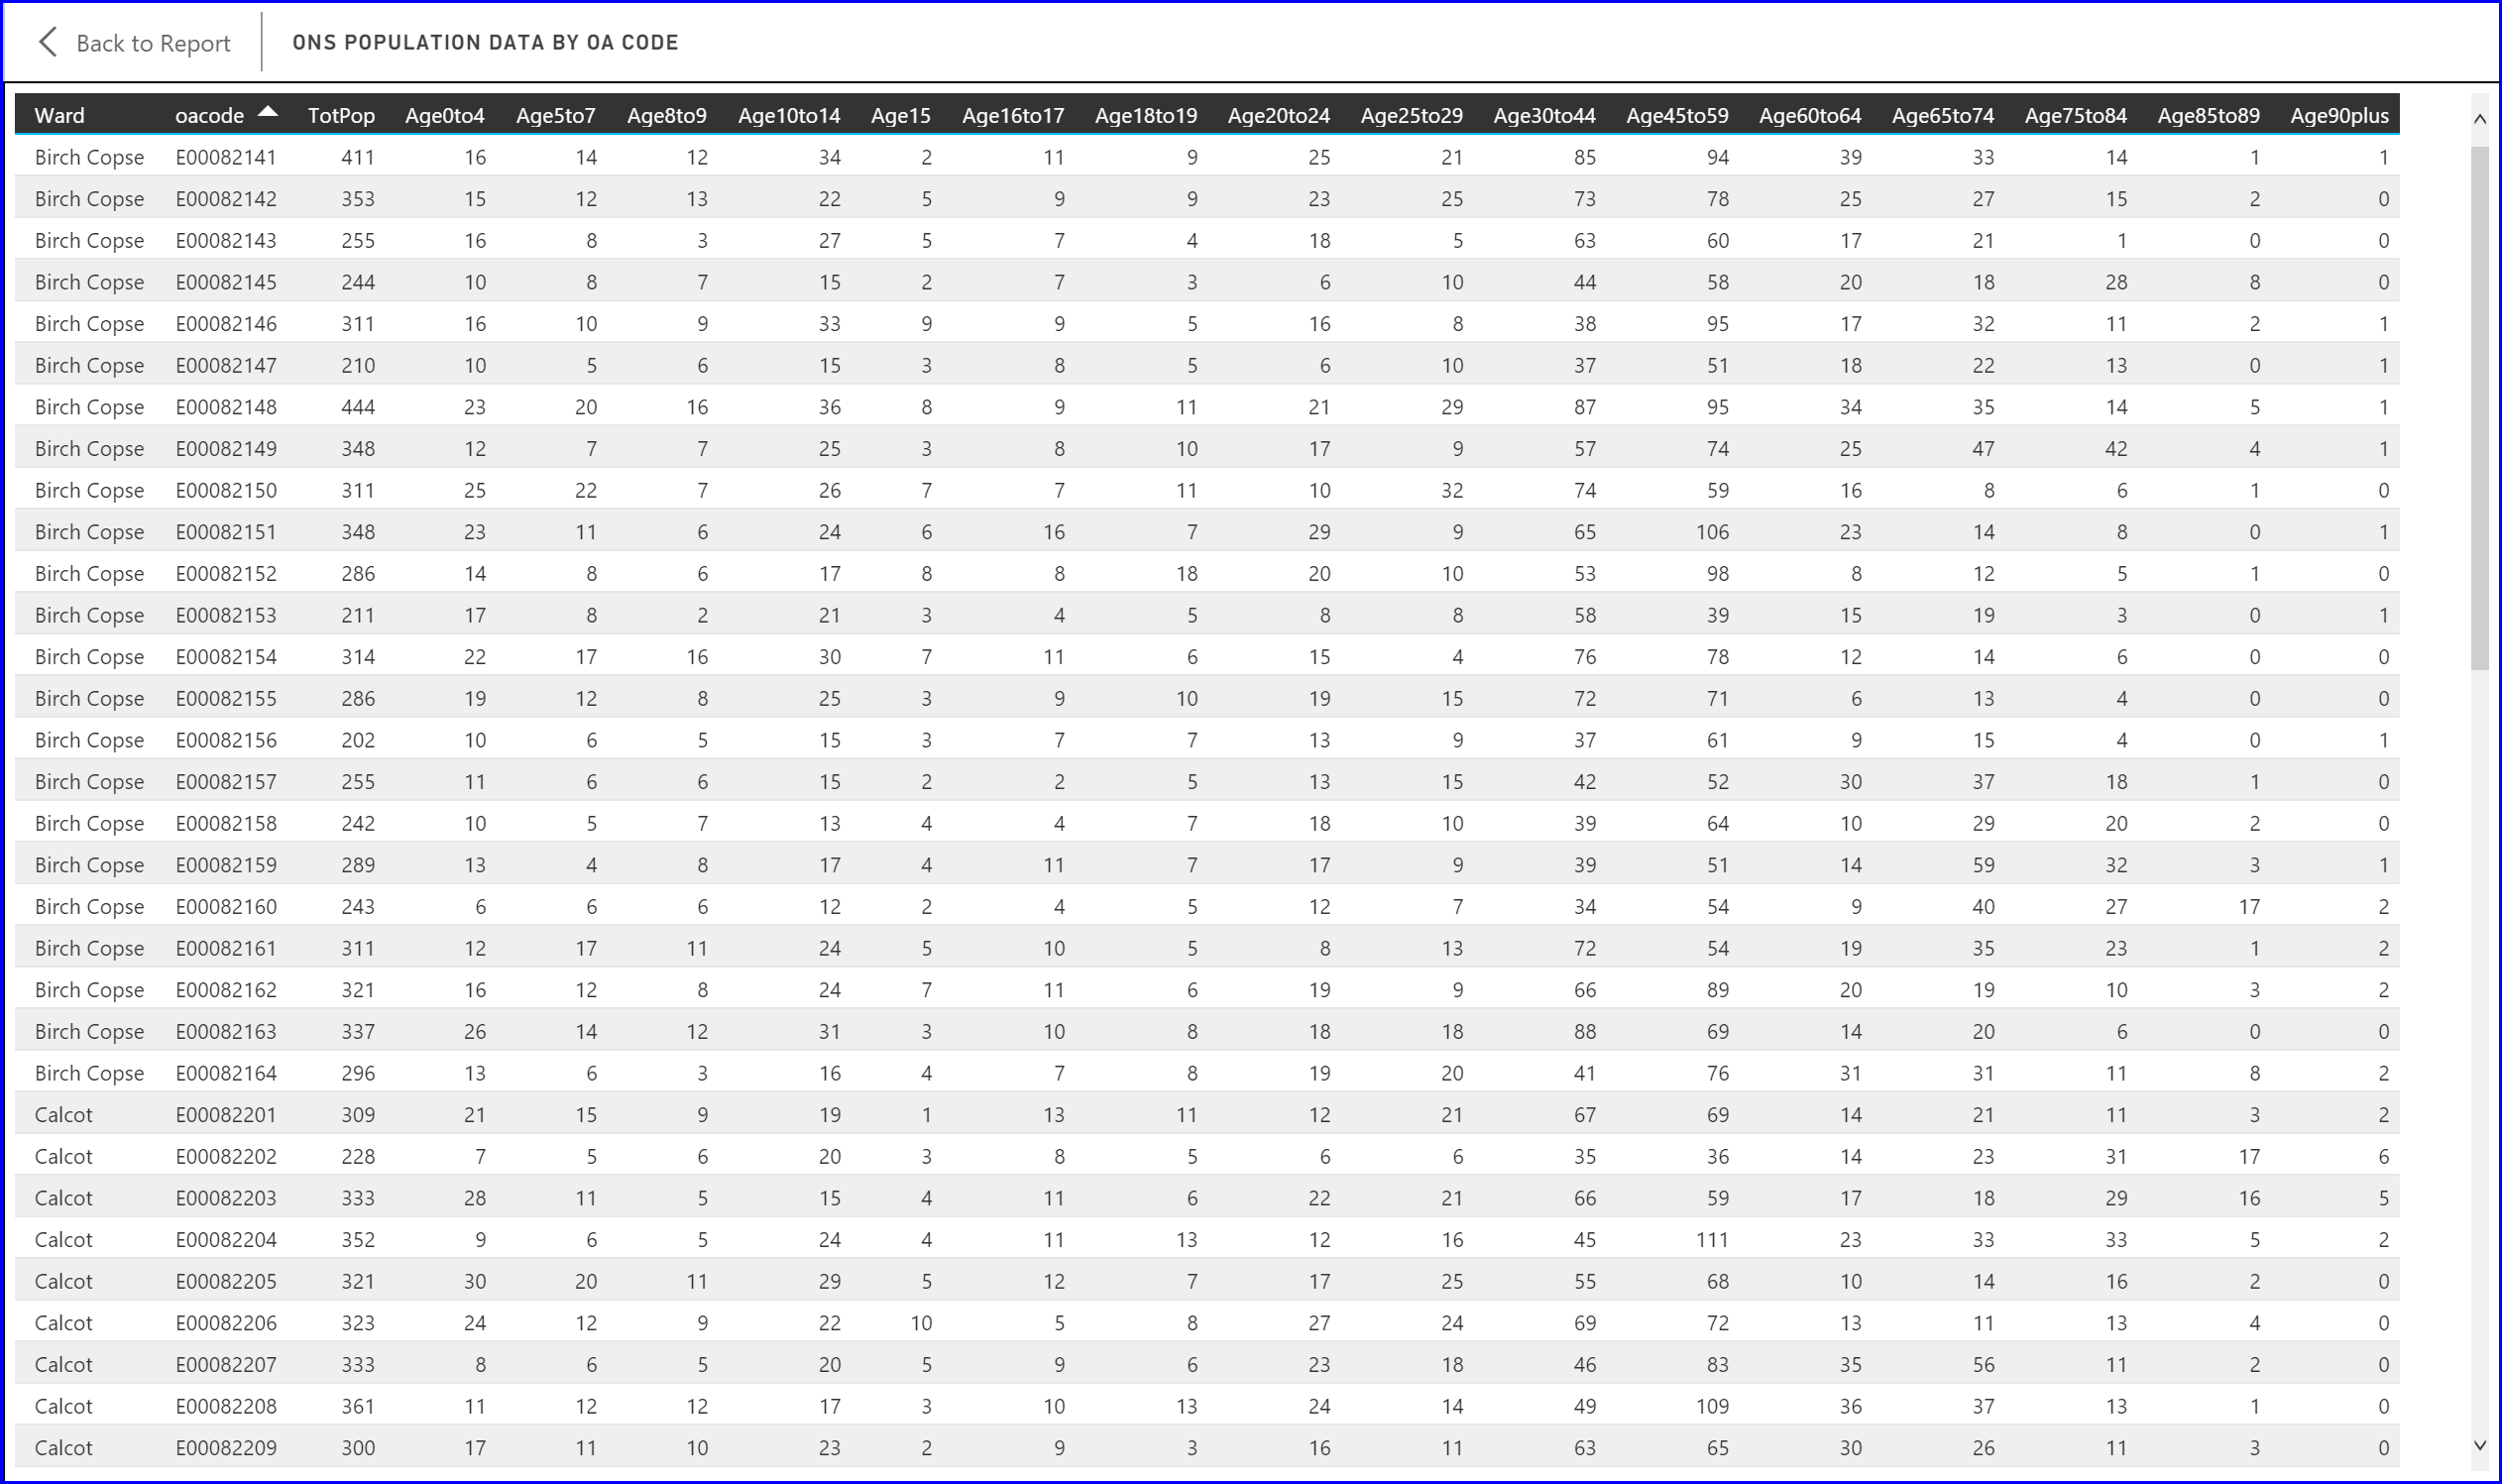
Image 6: Source ONS Census 2011 data consolidated by Geolytix
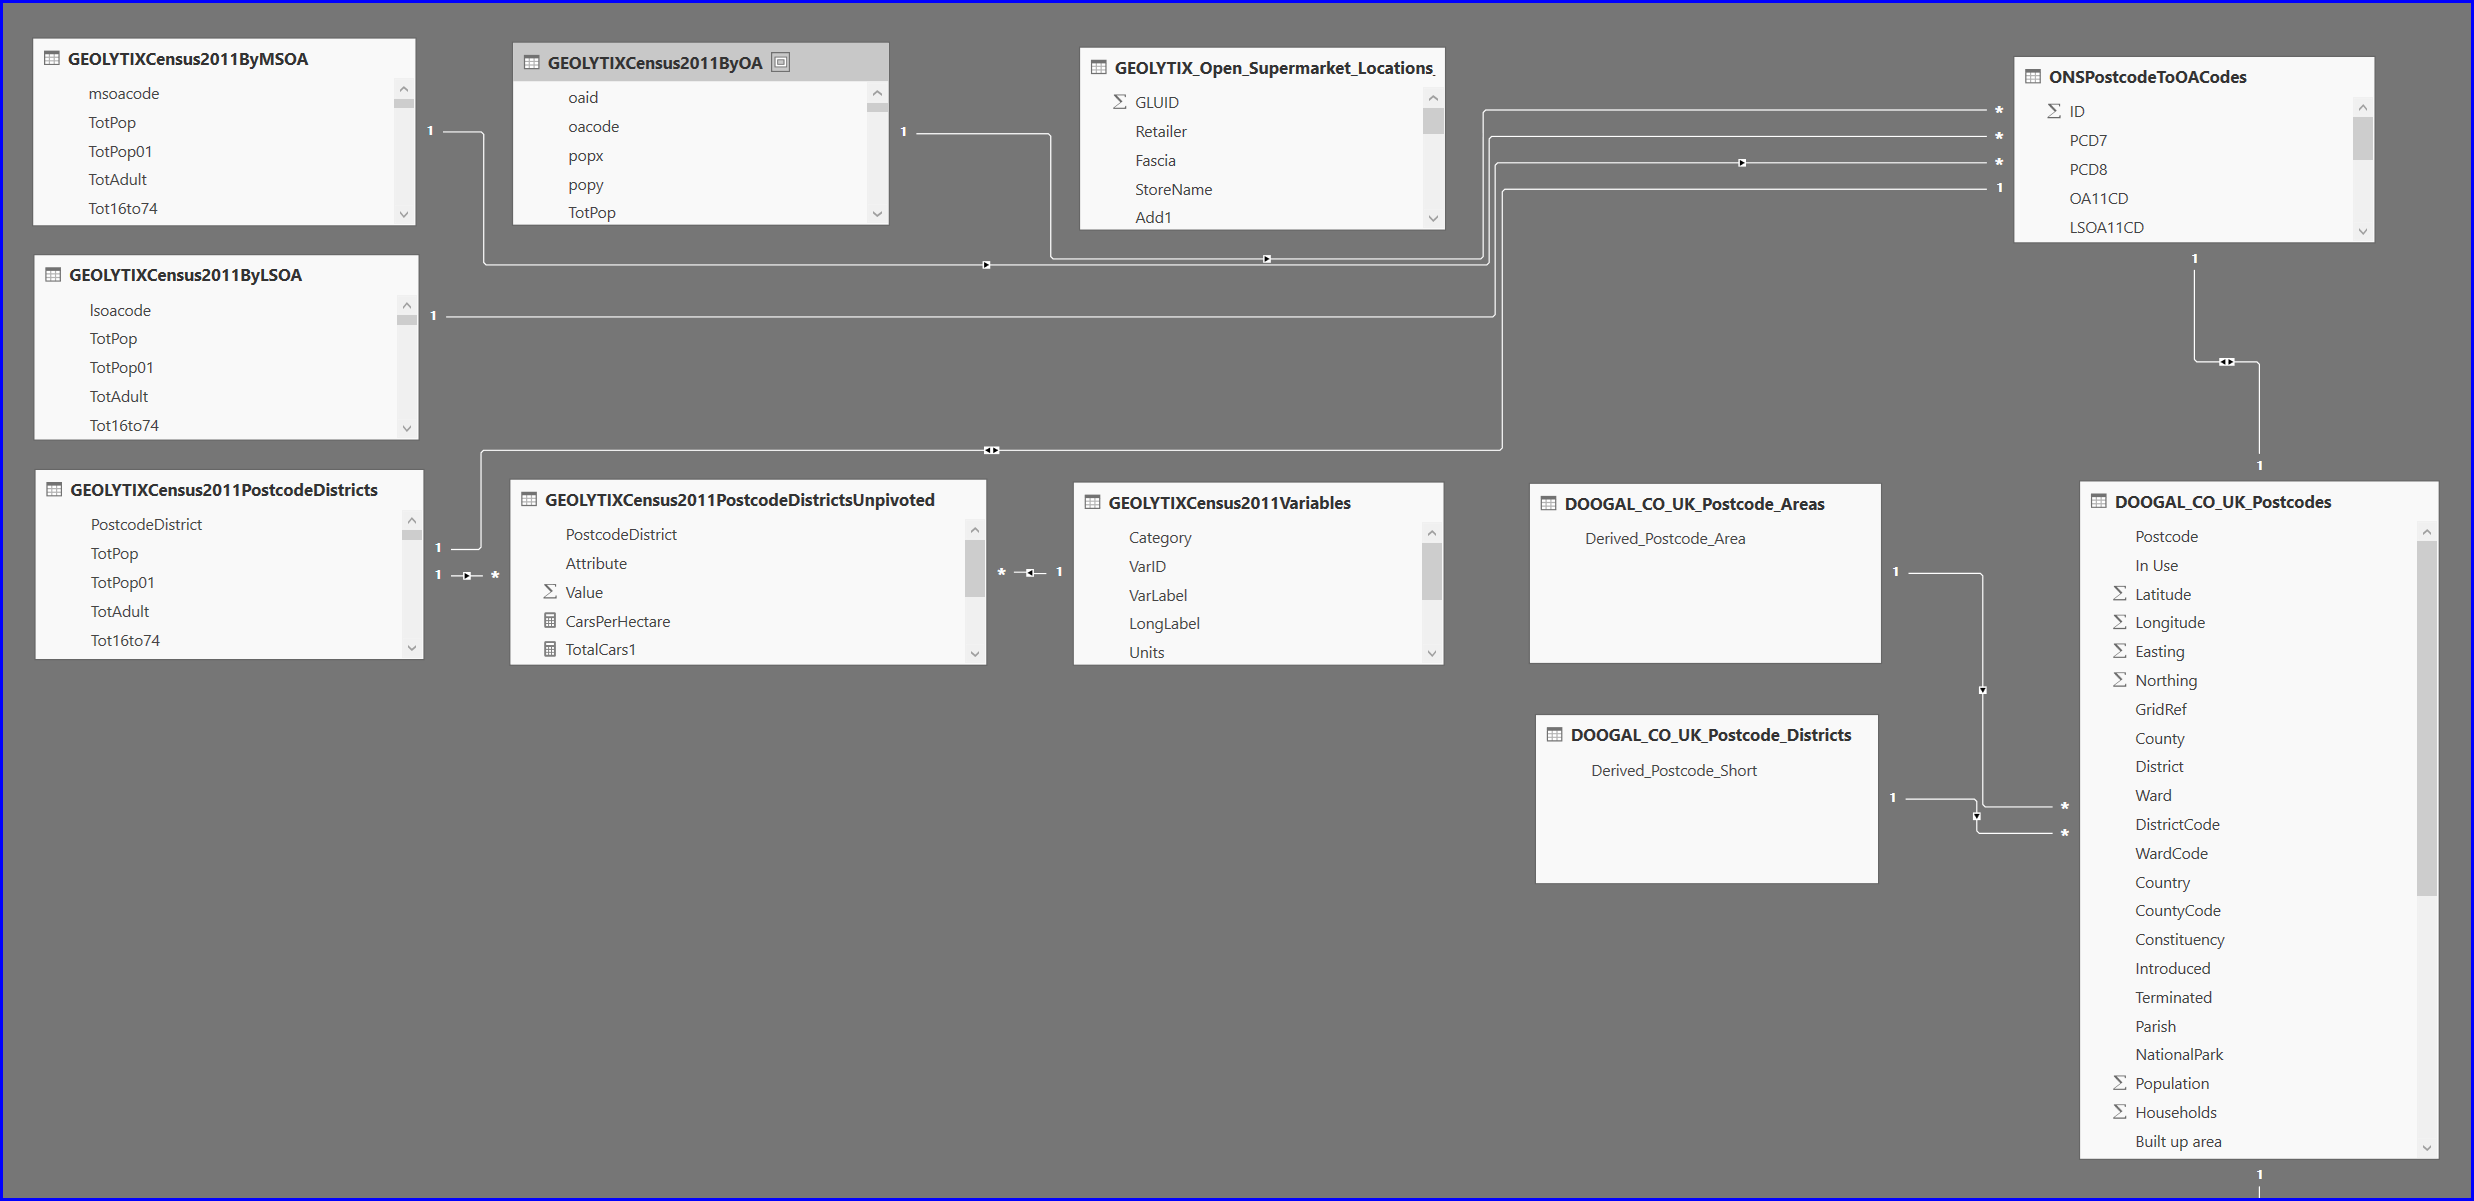
Image 7: Data model showing Geolytix and Postcode tables
Here’s hoping that this was of interest. If you have any questions feel free to contact me at fred.williams@insightfuldatasolutions.com
I will describe how I create the maps using the GIS software (Mapviewer 8) and the “Synoptic Designer website” soon.